lives of these nitroaromatics, the concentrations ob-
day. Beyond the first day, the rate of TNT loss is sig-
tained were plotted as the ln(C/C0) versus time (t),
nificantly slower. Because the concentration of TNT
where C is the concentration at time t and C0 is the
drops below 50% before the rate of loss slows, the first
initial concentration. For a first order rate process, a
half-life for TNT at room temperature was estimated
linear relationship should be obtained. If a process is
using the slope of the data plotted from days 0 through
first order, then the half-life can be determined easily
1. Additional half-lives will be estimated using the slope
using the simple rate equation:
of the data plotted from days 1 through 30. A similar
multi-stage process is indicated for TNT at 4C, but
ln (C/C0) = kt
the first stage is very short, lasting only through the
first 4 hours before the slower process takes over. The
where k is the rate constant equal to the slope of the
decrease in TNT concentration during this time is very
curve. The half-life is then calculated by dividing the
small, so the half-life here was estimated using the slope
natural log of 1/2 (0.693) by the rate constant. An
of the data plotted beyond the 4-hour mark. Data for
TNT at 4C, as well as for the other three key compo-
important point to note is that when the rate is first
order, the half-life is independent of the starting con-
nents at all temperatures, appear to be adequately de-
centration. Clearly, for the 22C data, the loss of TNT
scribed by a single first order processes. These data are
plotted for 4 and 4C in Figure 5. Rate equations de-
does not follow simple first order kinetics (Fig. 4). The
scribing the degradation rates for the primary analytes
plot also illustrates that the rate of degradation varies
at all three temperatures were established using the
greatly among the different compounds.
curve fitting functions in SigmaPlot, a commercial plot-
The data initially indicate that the rates for the deg-
radation of TNT at room temperature and at 4C are
ting package (Table 4). The half-lives for each com-
pound were then estimated by solving each of the func-
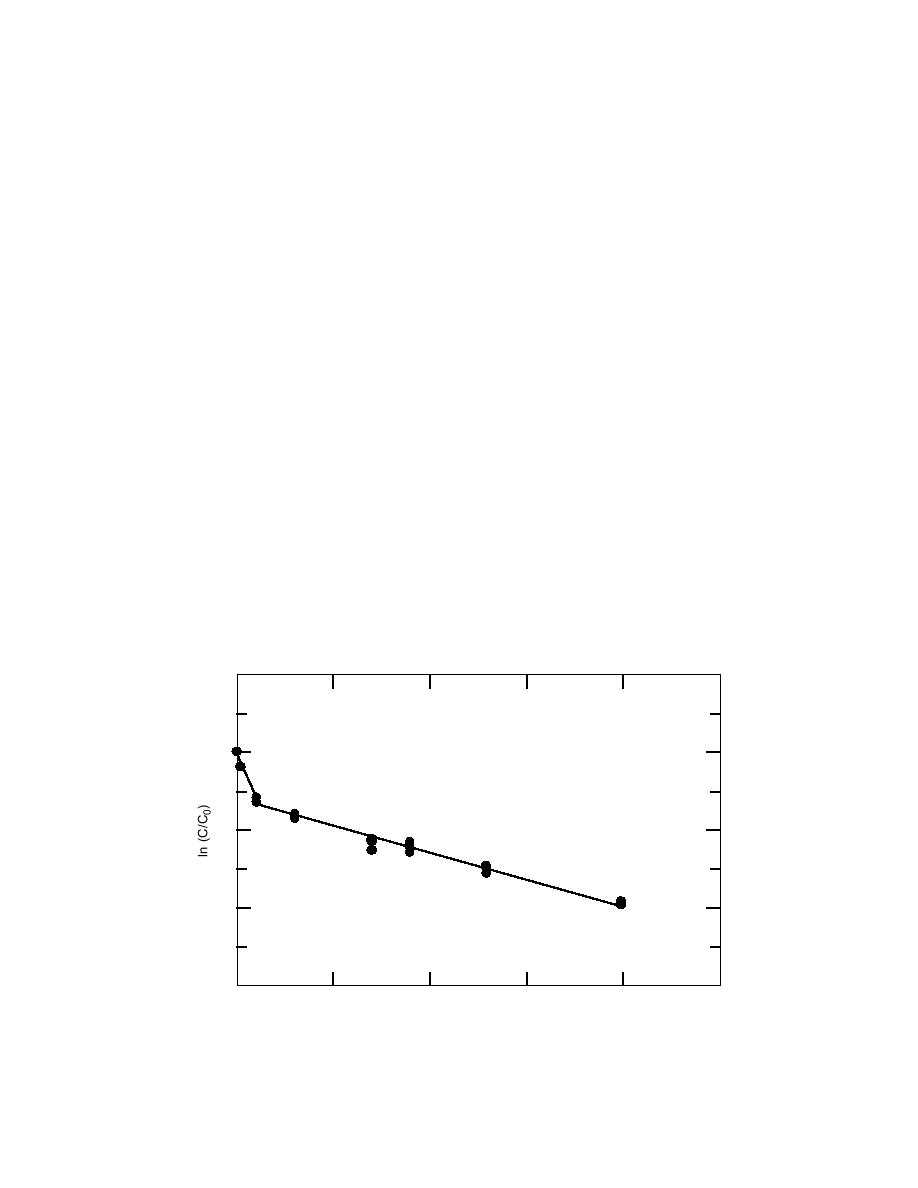
not first order. Close examination of the data at room
tions for time (t) when ln (C/C0) is equal to 0.693,
temperature reveals that the decay curve for TNT is
that is, one-half of the original concentration (Table 5).
composed of two linear sections, suggesting sequential
To demonstrate that the rate of degradation also de-
first order processes. Although the nature of the two
pended on soil type, we compiled the data collected by
processes is not understood at this time, the data indi-
Grant et al. (1993, 1995) for determining the pre-
cate that the first process is very rapid, causing a 50%
extraction holding times for soil samples (Tables A4 to
drop in the concentration of TNT in approximately 1
1
TNT
0
y = 0.573x 0.046
(days 0 to 1)
1
y = 0.068x 0.618
(days 1 to 20)
2
3
0
5
10
15
20
25
Time (days)
Figure 4. Plot of ln(C/C0) versus time (days) for TNT at room temperature (22 2C)
illustrating a multiple stage decay process.
8


 Previous Page
