impacted with residues. This is because TNT is a soot-
plate was buried in the snow. The surface soil under the
producing explosive and the black soot is easily seen
snow was thawed and this plate was used in an attempt
on the white snow surface. Second, large surface area
to minimize the amount of soil thrown by the blast. An
samples can be easily taken from the ash-covered areas
M-6 blasting cap was inserted into the fuse well of the
very simply using a snow shovel. And finally, a fresh
PMA-2 mine and the mine was placed on the snow sur-
snow cover can be clean with respect to residues of
face, directly above the steel plate. The mine was deto-
ERC. This may not always be the case at ranges where
nated electronically by the EOD team at about 10:30 a.m.
other detonations are commonly conducted. The advan-
At the time of the detonation, there was a slight breeze
tages of conducting this type of test at a snow-covered
from the west that carried the detonation cloud slightly
range were recently demonstrated for estimates of
downwind to the east. The main charge in the PMA-2
explosives-related residues produced by detonations of
mine was 100 g of TNT with a 13-g booster of RDX.
mortar rounds (Jenkins et al. in prep.).
Because the mine contained TNT as the main charge,
the detonation was characterized by the production of
Objective
black soot. This soot produced a cloud that settled on
The objective of this work was to evaluate the use
the snow surface and was quite visible, easily delineat-
of a snow-covered range to assess the identities and
ing the areas where residues were deposited. We decided
concentrations of explosives residues that remain after
to collect the surface snow samples before we measured
a land-mine detonation. This information, together with
the visually impacted surface area so as not to contami-
an estimate of the surface area impacted, will permit an
nate the snow samples. Snow samples were collected from
estimate of the mean surface concentrations of ERC
10:30 a.m. to 12:00 noon. The steel plate also was recov-
that result. Coupling these data with estimates of the
ered and returned to the laboratory for analysis.
Surface snow samples (25 ft2 [2.3 m2]) were col-
half-life of the various ERC components in the envi-
ronment will enable an assessment of the potential inter-
lected using an unpainted aluminum snow shovel. A
ference from detonations of land mines on the ability to
sample of snow from the crater was collected with a
detect buried land mines using trace chemical sensing.
small stainless-steel hand shovel. The depth sampled
for surface snow was kept as small as possible to min-
Sample collection
imize the volume of snowmelt that would be produced
On 23 March 2000, we detonated a PMA-2 (EX-
subsequently during sample preparation for ERC analy-
150) at Ethan Allen Firing Range in Jericho, Vermont.
sis. Depths sampled depended on the condition of the
snow in the various locations, but averaged about 0.5
Although the snow cover on the firing range was most-
cm. For collection, snow was shoveled into specially
ly gone, we found a shaded location along a tree line
cleaned polyethylene bags that were sealed with a twist
that was large enough to conduct the detonation study
tie. Snow samples were returned to CRREL the same
with the small PMA-2 mine, and on which the snow
day they were collected and were stored cold until pro-
surface was visibly pristine. A location was selected in
cessed the following day.
the center of the snow-covered area, a small hole was
dug in the snow, and a 25-cm 23-cm 0.6-cm steel
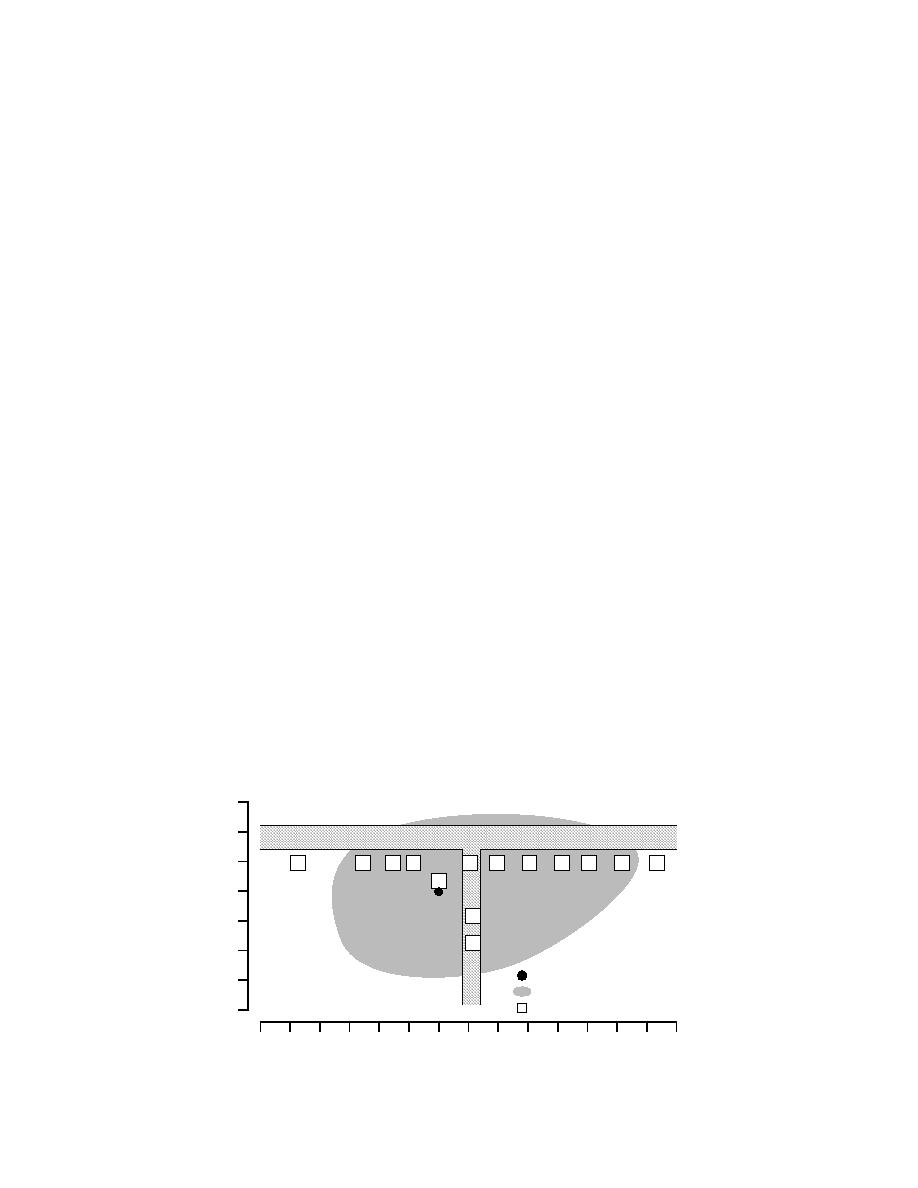
A total of 15 snow samples was collected; the loca-
tions where samples were collected are shown in Fig-
North
ure 1 relative to the visually impacted surface. Sam-
m
9
Gravel Road
6
3
S-6
S-5
S-4
S-3
S-2
S-1
S-1
S-2
S-3
S-4
S-7
E
E
E
E
E
E
W
W
W
W
E
S-8
0
S-2
3
S
S-1
S
6
Detonation Crater
9
≈
Visible Plume = 381 m2
Grassy Road
≈
Area Sampled = 2.3 m2
12
South
18
15
12
9
6
3
0
3
6
9
12
15
18
21
24 m
West
East
Figure 1. Locations of surface snow samples relative to area of surface deposition.
2


 Previous Page
