100,000
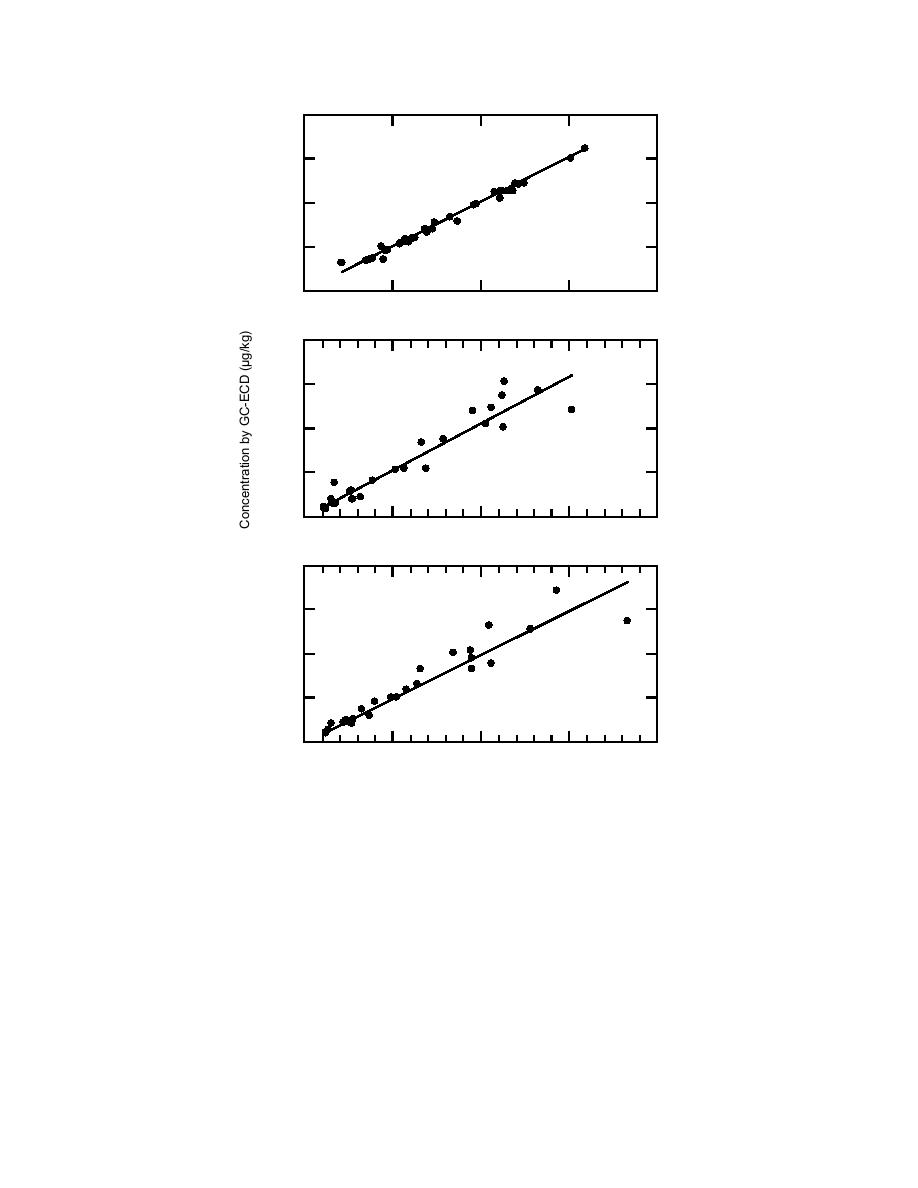
2,4-DNT
10,000
1,000
y = 1.04x
100
r = 0.996
n = 36
10
100,000
10
100
1,000
10,000
2,000
4-Am-DNT
1,500
1,000
y = 1.05x
500
r = 0.956
n = 26
0
0
500
1,000
1,500
2,000
2,000
2-Am-DNT
1,500
1,000
y = 0.993x
500
r = 0.951
n = 26
0
0
500
1,000
1,500
2,000
Concentration by HPLC (g/kg)
Figure 7. Correlation analysis of GC-ECD concentration (g/kg) esti-
mates with those from HPLC-UV analysis using splits of the same ac-
etonitrile extracts from soils collected from an experimental minefield.
Similar to the first set of samples collected from
the vapor pressure of these analytes might be suf-
this minefield, we detected 2,4,6-TNT generally at
ficiently high to make them valuable markers for
lower concentrations than the amino-DNTs, except
detection of emplaced mines. If other research
for samples collected in contact with a mine. The
shows that these analytes are important for mine
presence of the TNT biotransformation products
detection, analytical methods would need to be
implies that 2,4-DNT and 1,3-DNB biotransforma-
optimized for these compounds. Salting-in
tion products should be present as well. These
preconcentration with HPLC-UV detection would
products would be 2-amino-4-NT, 4-amino-2-NT,
be a viable approach.
and 3-nitroaniline. Unfortunately, the ECD re-
In the second set of samples from Fort Leonard
sponse is not strong for these compounds because
Wood, several very fine-grained wet soils were
they each have only one nitro group. However,
collected underneath a mine. Previously we ob-
27


 Previous Page
