300
TNT
200
100
y = 1.14x
r = 0.997
0
0
100
200
300
10,000
2,4-DNT
8,000
6,000
4,000
2,000
y = 1.12x
r = 0.997
0
10,000
0
2,000
4,000
6,000
8,000
Concentration by HPLC (g/kg)
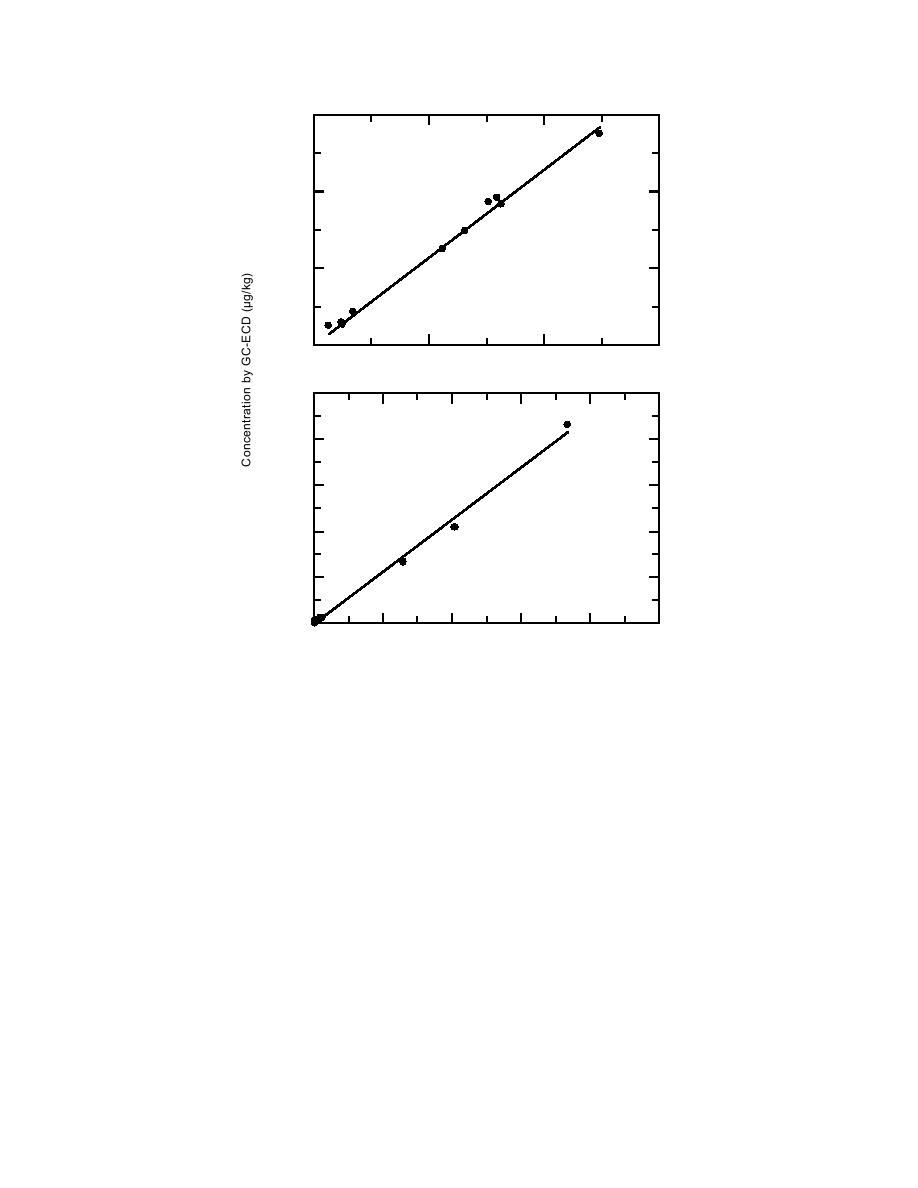
Figure 3. Correlation analysis of GC-ECD concentration (g/kg) estimates
with those from HPLC-UV analysis using splits of the same acetonitrile
extract (25 g soil:50 mL acetonitrile) from archived soils.
umn confirmation by GC-ECD. Two confirmation
We observed no degradation in the GC peak
columns that are more polar than the HP-5
shapes or heights despite an extended run with
analytical column were used. They were a Restek
over 70 injections of soil extracts and standards.
RTX-200 (Crossbond trifluoropropyl methylpoly-
siloxane) and Restek RTX-225 (50% cyanopropyl-
Confirmation columns
methyl50% phenyl methylpolysiloxane). Ex-
Because analyte identity is based solely on re-
ample chromatograms are shown in Figure 2 and
tention time when using an ECD, confirmation is
retention times are given in Table A3.
important. If concentrations are very high, a mass
Of these two columns, the RTX-225 was pre-
spectrometry or photodiode array detector can
ferred because RDX was resolved from 2-Am-
yield irrefutable confirmation. For lower concen-
DNT. These analytes co-eluted on the RTX-200.
trations, analysis by GC-ECD with confirmation
Another problem with the RTX-200 was an inter-
by HPLC-UV provides confirmation based on dif-
mittent interfering peak eluting just prior to 2,4-
ferent physical properties of the analytes (vapor
DNT. (This peak seemed to be associated with
pressure and polarity for separation, and elec-
plastics, such as the syringes used during filtra-
tronegativity and UV absorption for detection).
tion, but was not consistently present.) Neither
However, when concentrations are very low (less
than 50 g/kg), we must rely on secondary col-
column was suitable for confirming low concen-
13


 Previous Page
