0.10
0.08
0.06
0.04
Loose Slush
0.02
Dense Slush
Ice Floes
Freezeup Curve
Breakup Curve
0.01
0.1
1
10
100 (ft)
0.1
1
10 (m)
Ice Thickness
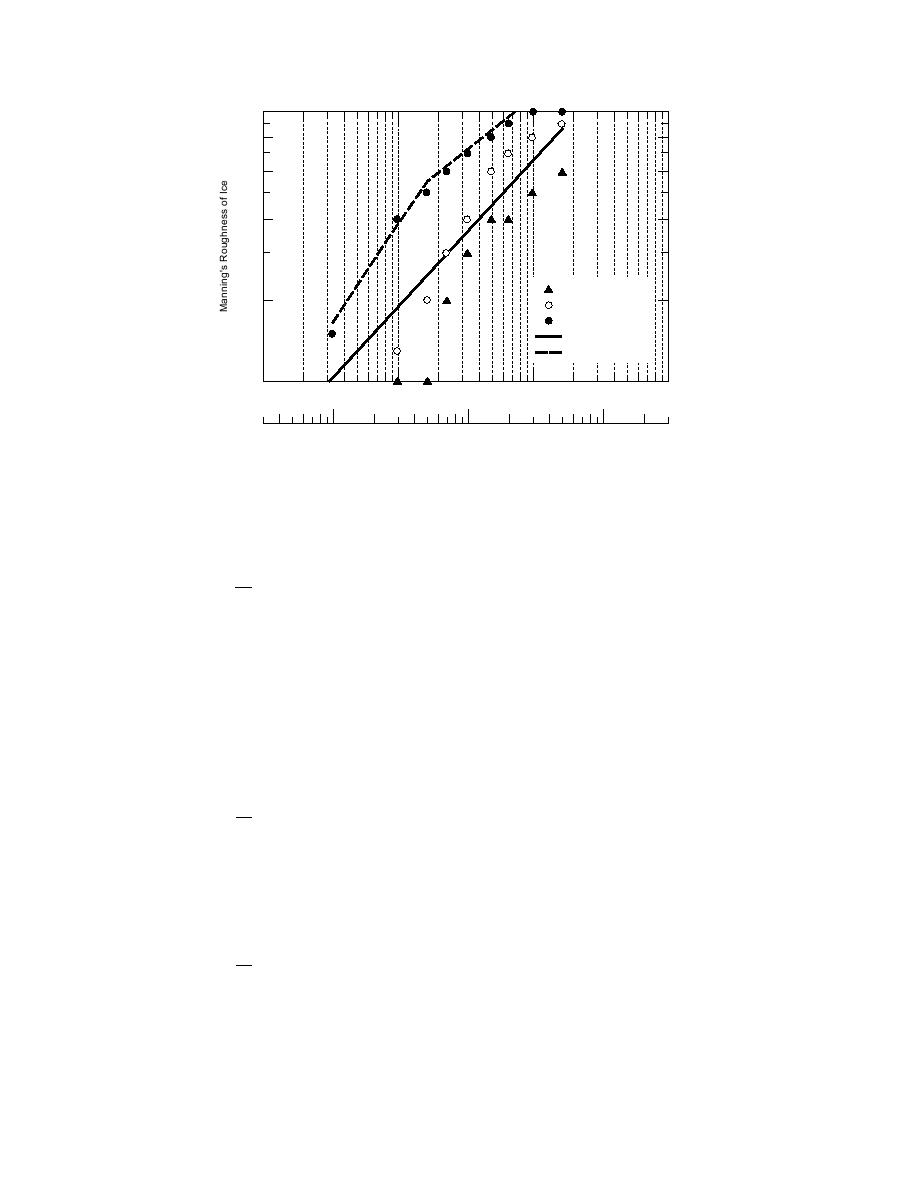
Figure 2. Nezhikovskiy's data plotted in loglog format with the ice-thickness-
to-ice-roughness relationships used in the ICETHK model.
-0.23
Ice in overbank areas
H
ni = 0.0588
0.40
ti
Once flow depth in the floodplain reaches a
2
threshold value, ice thickness in the overbank
areas is determined by the same steps and equa-
= 0.0690 H -0.23 ti0.40
tions as the channel ice thickness. The threshold
(6)
floodplain depth is defined by the multiplier XTo
times the pre-breakup ice thickness ITHICK.
where H = total water depth
Using the same calculation method to calculate ice
ti = measured thickness of the ice accumu-
thickness in the overbank as is used for the main
lation.
channel area relies on the assumption that the ice-
on-ice shear between the channel and floodplain
A second breakup relationship applies to ice
ice is approximately equivalent to the bank shear
accumulations less than 1.5 ft thick:
of a jam remaining in the channel.
-0.23
H
ni = 0.0506
ti0.77
2
STRUCTURE AND
OPERATION OF ICETHK
= 0.0593 H -0.23 ti0.77 .
(7)
ICETHK is designed as a utility program for
A third relationship predicts the roughness of a
HEC-2. Figure 3 shows the program's overall
freezeup ice jam:
structure and the interaction between ICETHK
and HEC-2. Boxes within the shaded line signify
-0.23
H
ni = 0.0249
ti0.54
ICETHK subprograms while boxes with rounded
2
corners indicate external input and output files.
Overall the structure is fairly simple: ICETHK's
= 0.0292 H -0.23 ti0.54 .
READT95 subprogram reads hydraulic data
(8)
from a HEC-2 T95 (output) file. The important
work takes place in the ICETHN, SHOVE, JUXT,
Nezhikovskiy's data and the curves produced by
JAMSEL, and RUFCALC subprograms. Here the
these three equations are plotted in Figure 2.
4


 Previous Page
