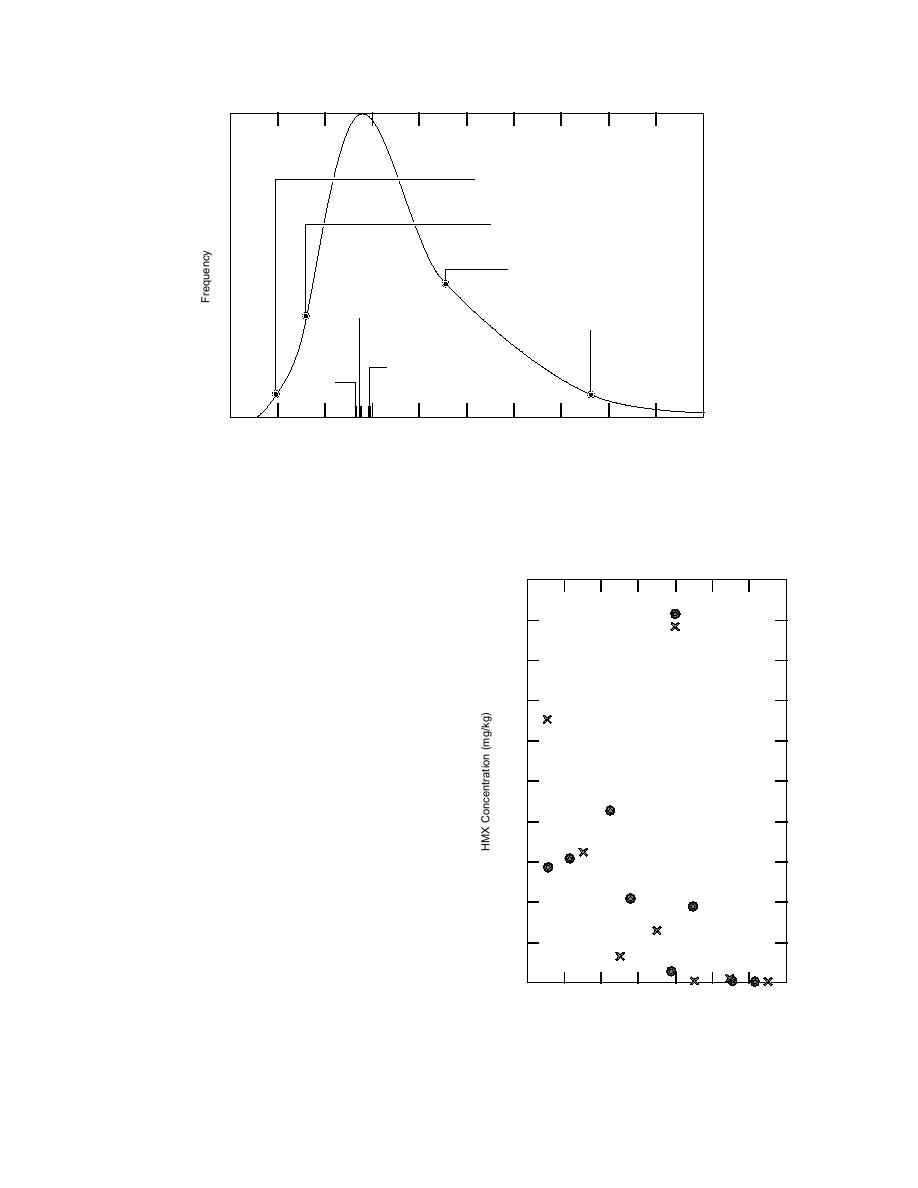
Geometric Mean
2 Standard Deviations
Geometric Mean
1 Standard Deviation
Geometric Mean
+1 Standard Deviation
Geometric
Geometric Mean
Mean
+2 Standard Deviations
Arithmetic
Estimate
Mean
from
Composite
0
100
200
300
400
500
600
700
800
900
1000
HMX Concentration (mg/kg)
Figure 10. Log-normal distribution of HMX for discrete soil samples from grid A, sam-
pling location 1-44.
trations of HMX in surface soils as a function of
distance from the target are plotted for sampling
location 1-44, along with similar data from CFB-
1000
Valcartier (Fig. 11). With concentrations decreas-
ing as distance from the target increases, a logical
Fort Ord
sampling array would use concentric rings with
900
CFB-Valcartier
the target at the center. Such rings might employ
radii varying by 3 to 5 m. Eight or more sample
800
points would be located equidistant from each
other around each ring, which would allow two
700
composite surface samples to be formed for each
ring (Fig. 12). Each discrete sample should con-
tain about a kilogram (200 g) of soil and be ho-
600
mogenized thoroughly prior to subsampling for
formation of composites, as described earlier in
500
the Experimental Methods section. Each composite
would contain one-half of the sampling points
400
chosen in an alternating pattern. Results of this
work demonstrate that EOD personnel can effi-
300
ciently collect soil samples for site characteriza-
tion at the same time that they are clearing the site
200
for unexploded ordnance. Since the major portion
of the explosives residues at the inland ranges are
in the surface soils, samples for additional charac-
100
terization should be relatively easy to collect. The
depth of contamination in specific areas can be
0
0
3
6
9
12
15
18
21
determined iteratively after the extent of surface
Distance from Target (m)
contamination is mapped.
The choice of four discrete samples per compos-
Figure 11. Concentration of HMX in surface soils at
ite is a compromise between 1) our desire to
Fort Ord sampling location 1-44 and CFB-Valcartier
improve the reliability of each analysis (represen-
as a function of distance from targets.
22


 Previous Page
