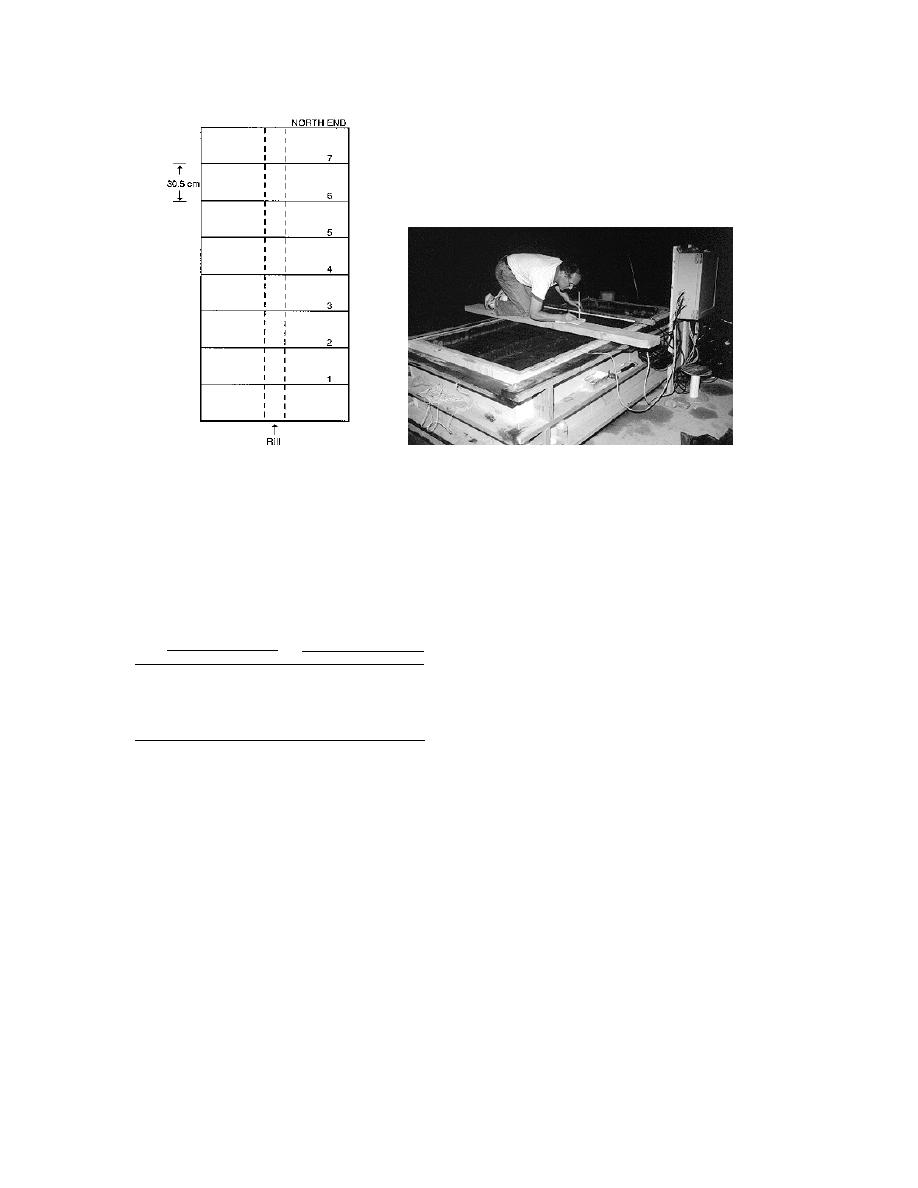
b. Measurements along profiles.
a. Profile locations.
Figure 17. Soil surface geometry measurements.
The degree of FT-induced rill side slope
Table 4. Frost heave (cm). Out-of-rill meas-
urements were made at stations 105, 90, 30, and
slumping would be directly related to the amount
15 on profiles 1 (P1), 3, 5, and 7. In-rill measure-
of soil water that's drawn into the freezing zone
ments were made at stations 65 and 55 on the
as frost penetrates into the soil. The amount of
same profiles.
frost heave is a measure of the amount of ice in
the frozen soil, which is determined by the
Out of Rill
In Rill
(n = 16)
(n = 8)
amount of additional water drawn to the freezing
Max. Min.
Avg.
Max.
Min.
Avg.
soil, which in turn is determined by the tempera-
ture gradient in the soil and the amount of avail-
F1
2.2
0.8
1.5
1.2
0
0.4
(P3)
(P7)
(P3
(P1,7)
able soil water. Upon thaw, the additional soil
water tends to saturate surface soils, making
F2
3.1
1.8
2.5
2.2
0.8
1.4
(P5)
(P1)
(P5)
(P1)
them susceptible to soil flows and slumps. Ice
lenses in the surface soil and scattered needle ice,
0.11.0 cm long, on the soil were visible at the end
what surprising in that Tssr was usually 0.1 to
0.6C lower than Tssc (Fig. 18) and I would have
of F1 and F2, which suggests that sufficient water
had been drawn into the freezing soil to saturate
expected that this lower temperature would have
the surface soils when thaw began.
established a steeper temperature gradient below
Water was added to the surface soil at the end
the rill, causing more soil water movement to the
of each freeze. Before the panels were removed,
freezing zone under the rill, resulting in greater
warm refrigerant was circulated through them.
in-rill heave.
Otherwise, cold refrigerant warming in the
The rill profiles measured 2 hours before F1
panels would expand and rupture them. When
and 30 minutes after T1 began (Fig. 22a,b) show
the panels heat up, the needle ice that forms on
that the frozen rill sidewalls were generally near-
their undersides during a freeze (Fig. 23a) par-
er to vertical than before they were frozen, which
tially melts, and slush ice and meltwater fall onto
suggests that the soil along the rill wall near the
the soil (Fig. 23b, 24a). This additional water
crests heaved more than that near the rill bottom.
(I did not measure its volume) would simulate a
Heat loss from the soil near the rill crest may be
storm of very wet snow falling on a frozen soil
enhanced because of the two surfaces through
surface and the degree of saturation of the sur-
which the heat can flow to the air. Consequently,
face soil as it starts to thaw would likely be com-
more soil water could have been drawn to the rill
parable to that which may be found in the field
crest and frozen.
17


 Previous Page
