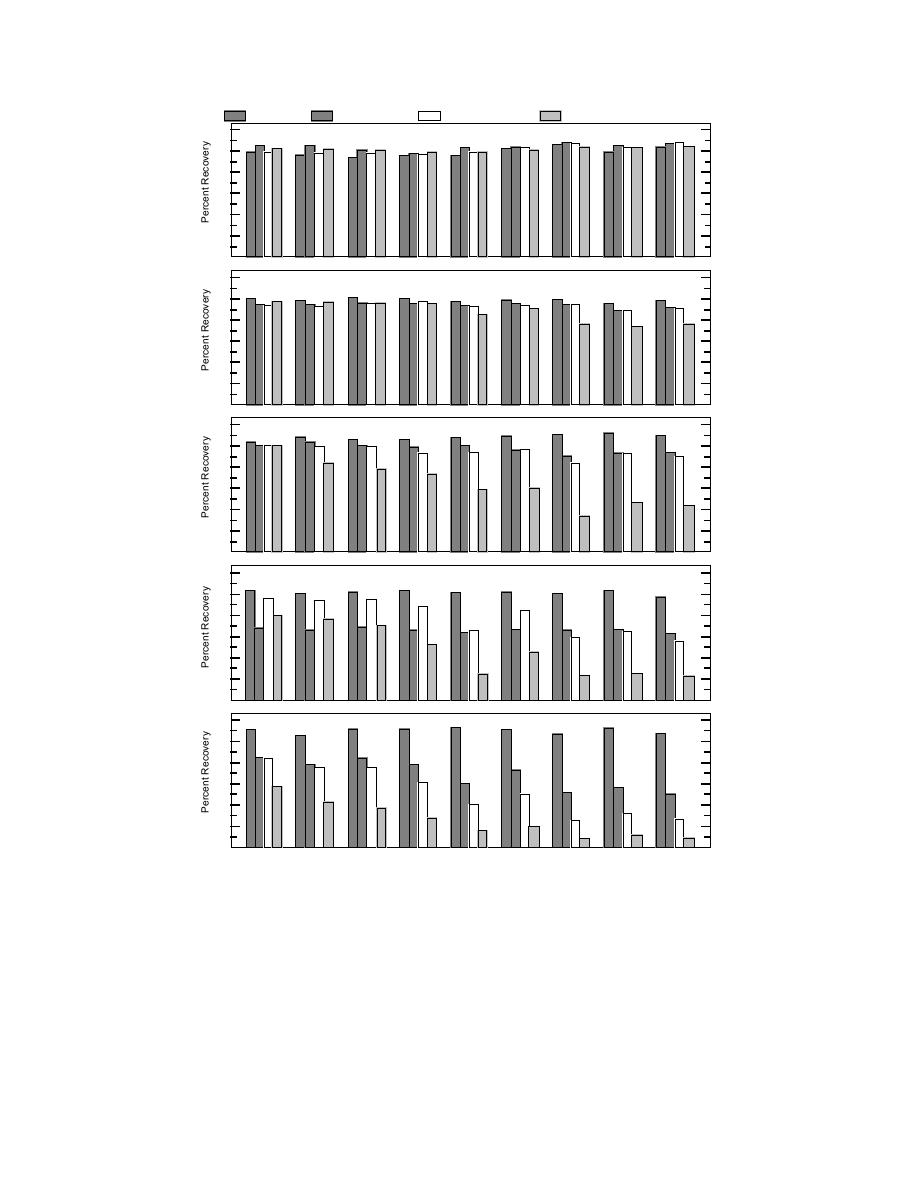
Ottawa Sand
Ft. Edwards Clay
CRREL-A Silty Sand
Pt. Barrow, Alaska Peat-Silty Clay
120
MeOH Extraction
100
80
60
40
20
0
120
Tetraglyme Extraction
100
80
60
40
20
0
120
Heated-headspace Analysis
100
80
60
40
20
0
120
Headspace Analysis of Soil/Water Slurry Preserved with NaHSO4
100
80
60
40
20
0
Headspace Analysis of Soil/Water Slurry Saturated with NaCl and Acidified with H3 PO4
120
100
80
60
40
20
0
TDCE
CDCE
Ben
TCE
PCE
Tol
o-Xyl
E-Ben
p-Xyl
Figure 1. Mean percent recovery from aqueous spiked soils.
chemical transformation, or loss (destruction)
for this extraction time. This statistical analysis
trend was seen with chlorinated compounds after
showed that MeOH consistently produced high-
4 days for the tetraglyme extraction from the Ft. E
er concentration estimates for all of the VOCs with
soil. This was particularly striking for TCE and
the Pt. B and CR-A soils, while there were no sig-
PCE (Fig. 2d and f).
nificant differences between these two solvents for
Table 6 also shows the results of the statistical
the Ft. E soil.
analysis of the comparison of the extraction effi-
ciencies of these two solvents for the 4-day extrac-
Vapor fortification treatment--experiment III
tion period. The 4-day period was chosen since
Table 7 shows means and standard deviations
the highest analyte concentrations often occurred
for VOC concentration estimates by six different
7


 Previous Page
