4
nel shape observed on Oil Creek, indicating the
water surface velocity distribution and the even-
tual freeze-up pattern (Fig. 10). The ripple lines
Conventional Froude Limit
created by the shear boom were parallel to the
For Ice Cover Formation
3
boom. The plastic particles decelerated once they
passed through this line. This line appears to sepa-
rate the water surface areas affected by the floating
structure from those areas that are not.
The shear boom guided the incoming parti-
2
cles to the low-velocity collection zones along the
Sag Boom Only (effective)
shore. The distribution of the particles became
Sag Boom (ineffective)
more uniform as the accumulation of beads thick-
Shear Boom (effective)
ened, followed by a stage rise. The particles thick-
1
0
0.1
0.2
0.3
en due to shoving caused by the increase in a shear
Froude Number
force acting on the underside of the cover. The bead
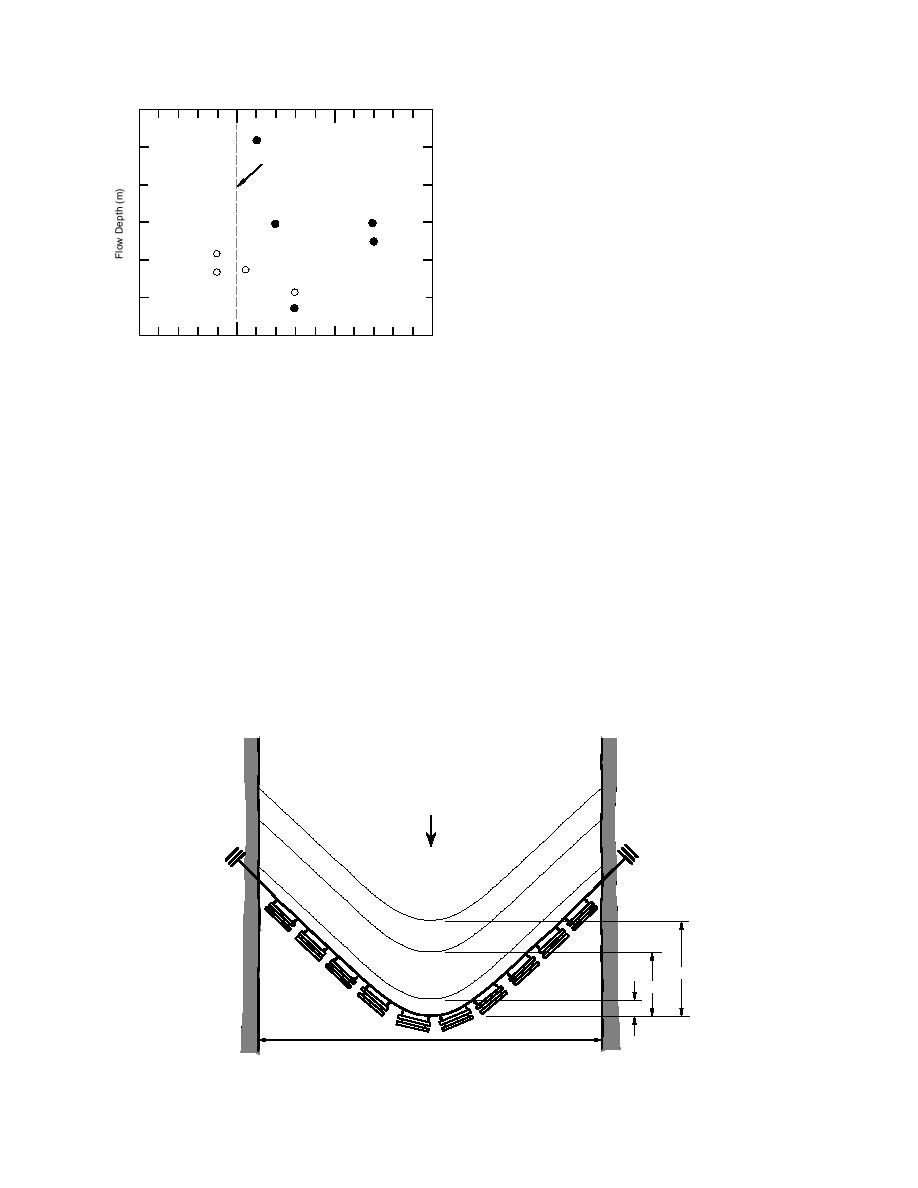
Figure 9. Froude number vs. flow depth for model
cover progressed upstream at a rate dependent on
booms.
the incoming concentration of particles and the
amount of shoving and thickening. The capture
at a 1:25 scale and tested in an existing hydraulic
efficiency improved as the ice boom geometry was
model and a 4-ft-wide rectangular flume. The per-
changed (Table 2). A comparison between the
formances of a shear boom and a single-sag boom
model and the field data indicate a substantial im-
were compared (Fig. 9). A 3-mm plastic bead
provement in the capture efficiency. If we compare
material was used to simulate real ice. The plastic
Froude number (Fig. 6 and 9) prior to freeze-up at
beads were introduced upstream of each boom.
field sites and also prior to simulated ice condi-
When the flow discharge was increased, the sag
tions in laboratory simulations, we find similar
boom released the bead particles while the shear
results between the sag boom and shear boom
boom held them. By increasing the capture effi-
designs. The shear boom can capture ice at higher
ciency of the boom, the flow depth was increased
flows and results in an immediate benefit by reduc-
and the velocity upstream of the boom was reduced.
During the tests a ripple line was observed on
ing the velocity further through the thickening of
the water surface, created by the floating struc-
the ice accumulation. The fact that prototype and
tures. The ripple lines followed the shape of the
model measurements indicate a higher Froude
floating object and were distinctly different with
number indicates how important the shape is in
changes in the boom geometry and discharge. The
the ice collection ability of an ice boom and subse-
sag boom created a ripple line similar to the fun-
quent flow conditions upstream of the boom.
Q
1060 gpm
1220
2.0 ft
1.5
1860
0.5
21 ft
Figure 10. Water surface velocity distribution just upstream of a boom.
7


 Previous Page
