120
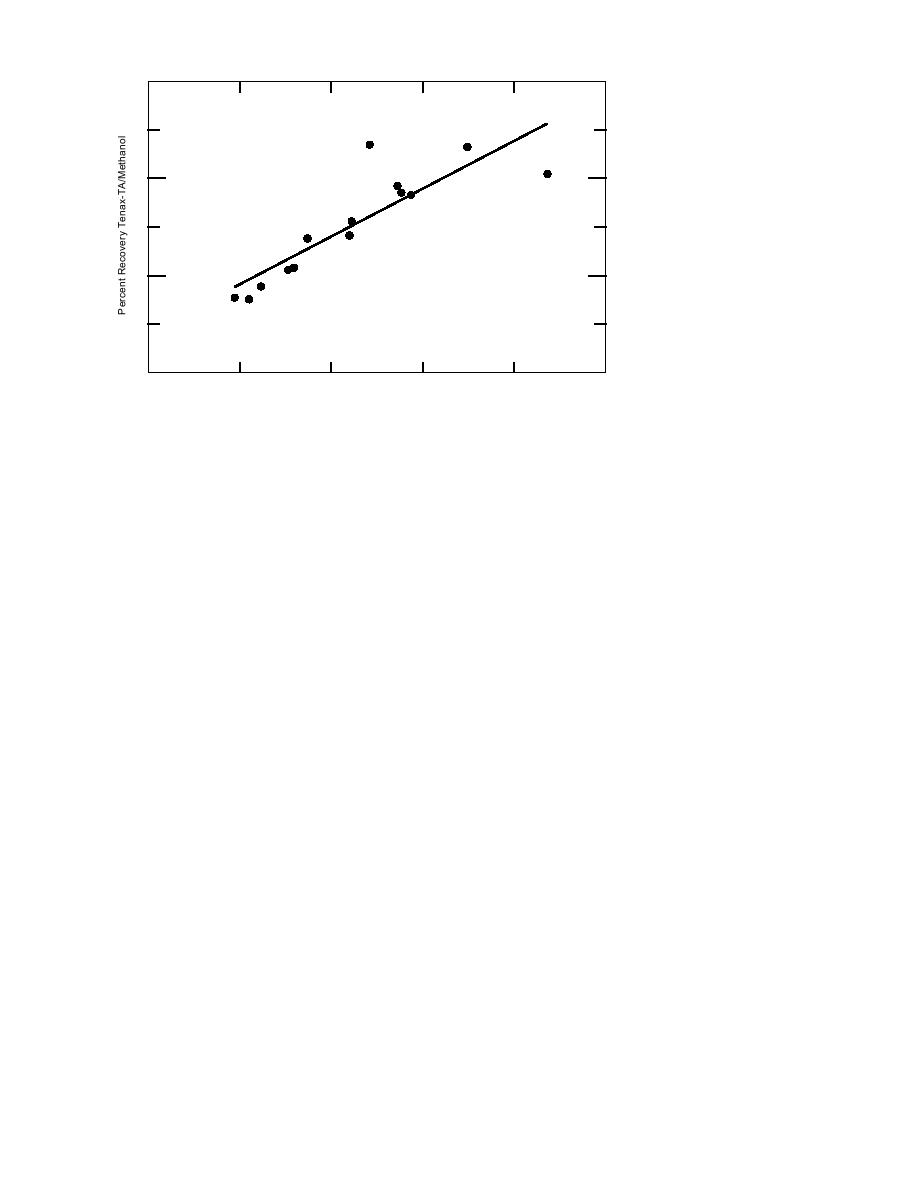
Slope = 0.40
y-intercept = 16.3
r 2 = 0.7464
80
Best
Fit
40
Figure 2. Percentage analyte
recovery by the Tenax-TA
sorbent relative to methanol
0
50
100
150
200
250
extraction vs. boiling point.
Boiling Point (C)
main stable for extended periods (several months),
ously for soils with a low (<1%) organic carbon
and the vessel can be intermittently opened for
content (Hewitt et al. 1992).
aliquot removal without significant losses (Hewitt
In comparison, the sorbent pack TD/GC/MS
1995b). Therefore, the immersion of a soil sample
analysis attained a maximum recovery after 9 days
into an organic solvent also accomplishes the in-
of exposure, showing analyte concentrations 30%
tent of in-vial handling and analysis protocols,
to 93% of that established by MeOH extraction
relative to controlling volatilization losses.
PT/GC/MS analysis. The analyte recoveries es-
Individual Tenax-TA packs from the Gore-
tablished by the Tenax-TA sorbent is a function
Sorber modules were analyzed by thermal des-
of its affinity for the individual VOC vapors, and
orption gas chromatography mass spectrometry
their release from the desiccated soil. By plotting
(TD/GC/MS), using a Level 1 screening proce-
the percentage recovery after 9 days of exposure
dure (W.L. Gore & Associates). This semiquanti-
for the Tenax-TA sorbent relative to the MeOH
tative procedure establishes a compound mass,
extraction results vs. the boiling points of the
based on a single point calibration 5-g standard
analytes, an direct relationship is established (Fig.
mass, and has a reported detection limit of 0.02
2). Clearly, this sorbent's ability to passively ac-
g for TCE.
quire VOCs from this matrix is dependent on the
boiling point (i.e., vapor pressure).
Qualitatively, the TD/GC/MS analysis of the
sorbent pack was able to rapidly (1-day expo-
RESULTS
sure) identify all of the analytes present in the
vapor fortified QA soil sample (Table 1). Thus,
Laboratory-fortified soil
Table 1 shows the VOC concentrations deter-
even under a desiccated condition where soils
mined for the vapor fortified soil samples by HS/
show a much greater capacity for the sorption of
GC, PT/GC/MS (Method 8260) and by TD/GC/
VOCs (Chiou and Shoup 1985) and analytes may
MS analysis of the Tenax-TA packs after three
be held to crystalline surfaces by physical forces,
different exposure periods. All concentrations are
such as van de Waals (Sawheny and Gent 1990),
expressed on a mass per mass basis since the
this technology is effective on a relative basis.
amount of soil present was known. Quantitatively,
both HS/GC and PT/GC/MS (Method 8260) es-
Field samples
tablished similar concentrations for 12 of the 14
The results shown in Table 2 are for locations
analytes (two compounds were not determined
where a grab sample was collected at a depth of
by HS/GC analysis due to co-elution). Good agree-
85 cm and placed in a jar with the Gore-Sorber
ment between these two methods of sample prepa-
module. This table also includes results for
ration and analysis has been established previ-
colocated grab samples collected some 7 cm above
5


 Previous Page
