composed of a HS auto sampler (Tekmar 7000)
coupled to a GC (SRI, model 8610-0058). Addi-
tional information concerning sample analysis and
the operating conditions used with these instru-
ments can be found elsewhere (Hewitt et al. 1992,
Hewitt 1995a).
Concentration estimates were established on
moist weight basis relative to working standards,
which were prepared by spiking analysis vials
(jars) that contained the same amount of water as
~2.5 cm
the samples with small volumes (<100 L) of a
methanol stock standard. The stock standards
Figure 3. Sampling pattern for composite samples.
were prepared on a weight basis, then volumetri-
cally diluted as necessary. Samples and standards
teen, 3-cm3 tipless syringes were inserted vertically
were hand shaken for at least two minutes prior
in a 4 4 array (Fig. 3) into the bottom of a 38-cm
to analysis. This approach to the analysis estab-
hole. Once all the syringes had been positioned,
lishes VOC concentration estimates that often are
one from each row and column of the 4 4 array
not significantly different than more rigorous
was randomly removed and its contents quickly
purge-and-trap procedures when the soil matrix
composited (4 separate plugs) into either a VOA
has a low (<1%) organic carbon content (Hewitt et
vial containing 10 mL of water or empty VOA that
al. 1992).
was then covered with Parafilm. For the vials cov-
ered with Parafilm, this temporary covering was
removed after a 2-minute period and 10 mL of
RESULTS
water was added. The 4 4 sampling array al-
lowed for duplicates of the composited samples
Core liners
to be compared. This series of steps was repeated
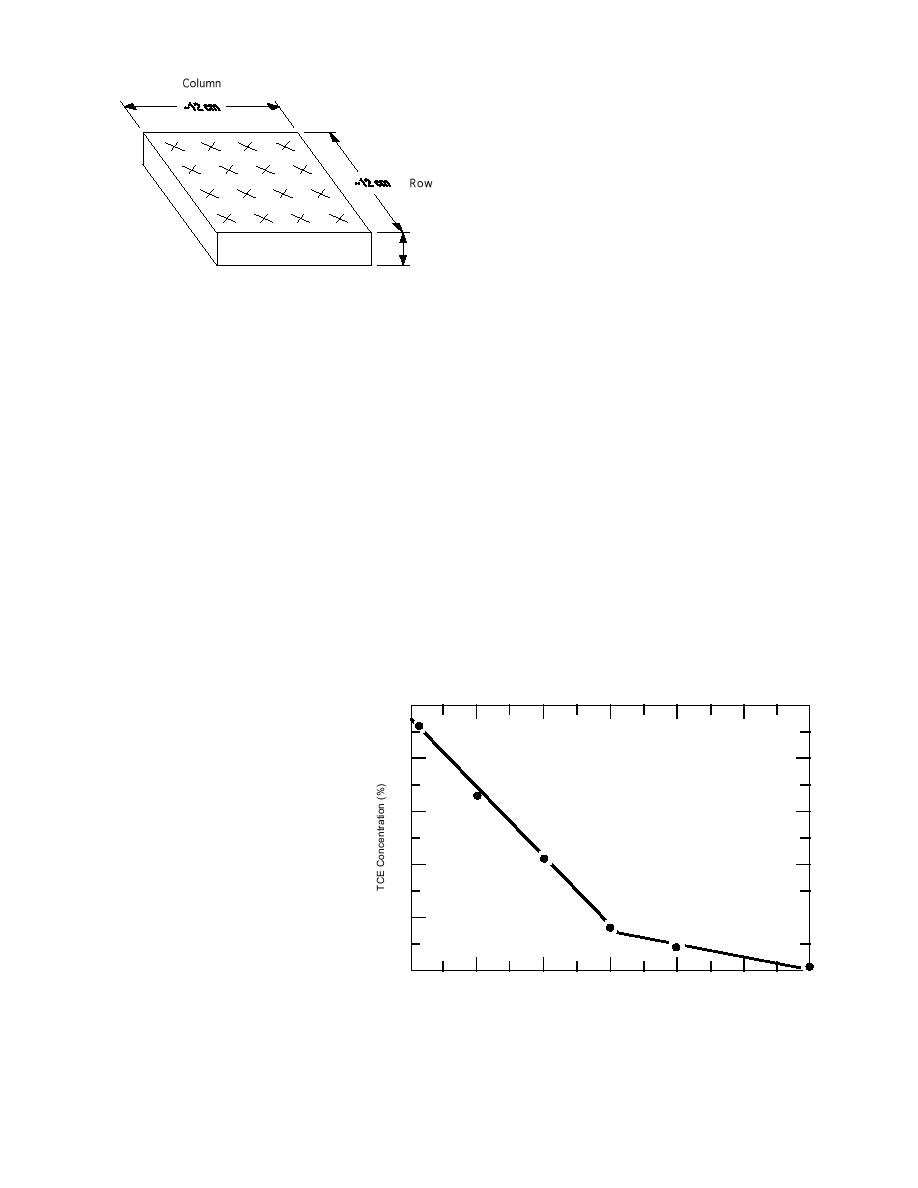
A greater than 90% decrease in TCE concentra-
in the same hole at depths of 40, 43, and 46 cm. At
tion resulted in less than 40 minutes for the
the next two depths (40 and 43 cm) the vials with-
samples collected and stored in core liners, when
out water were sealed with Teflon-faced gray bu-
compared to the mean of the four refer ence
tyl rubber septa and aluminum crimp tops, and
samples obtained around the liners' exterior (Table
they were opened after 20 or 200 minutes to add
1). In addition, the rate of TCE loss during the first
10 mL of water and then recapped. At the depth
30 minutes was greater than the subsequent 30
of 46 cm, 10 mL of water was added immediately
minutes of exposure (Fig. 4). Therefore it is rea-
after the last soil plug of four being
composited had been transferred to
100
the empty VOA vial. In all cases,
the plugs of soil remained intact
during collection process; i.e., they
80
remained in the cylindrical shape
created by the coring tool even af-
ter they were transferred to the
60
analysis vials.
40
ANALYSIS
All samples were analyzed by
20
equilibrium headspace (HS) analy-
sis. Samples transferred to 44-mL
VOA vials or 500-mL jars were ana-
0
10
20
30
40
50
60
lyzed on a model 10S10 PhotoVac
Exposure Time (min)
gas chromatograph (GC). Samples
transferred to 22-mL VOA vials were
Figure 4. Concentrations of TCE established exterior to and within un-
analyzed on an automated system
covered core liners.
4


 Previous Page
