EQUATION" bar. A new dialogue box will appear that contains a column entitled "OUTPUTS." This
column contains hourly values and can be edited by highlighting the value to be edited, entering the
desired value, and hitting the return key. One can scroll through the outputs column by using the scroll
bar in the center of the dialogue box. The graphical functions can currently store 90 hours of data, but
can be reprogrammed for significantly more data storage. For more information on graphical func-
tions, see p. 4-184-20 in Richmond and Peterson (1994).
Meteorological input parameters are currently programmed with temperature, snowfall, and rain-
fall data recorded at the Elora Research Station in Elora, Ontario, Canada, for the 3 April to 11 April
1985 recording period. All other input parameters reflect typical spring snowmelt conditions for a
watershed in southwestern Ontario (Schroeter 1989). Specific programming instructions for the ob-
jects in each sector are further described beginning with the next section.
iquid Water Released from
b
nfiltration
urface Runoff
D
the Snowpack
S
SRF RUNOFF
INFILTRATION
INFILTRATION
INFILTRATION
SRF RUNOFF
SRF RUNOFF
LIQ WTR REL
LIQ WTR REL
LIQ WTR REL
I Baseflow
ischarge
L
Subsurface Flow
BASEFLOW
BASEFLOW
BASEFLOW
SUBSRF FLOW
SUBSRF FLOW
SBSRF FLOW
DISCHARGE
DISCHARGE
DISCHARGE
lue box
object
graph
table
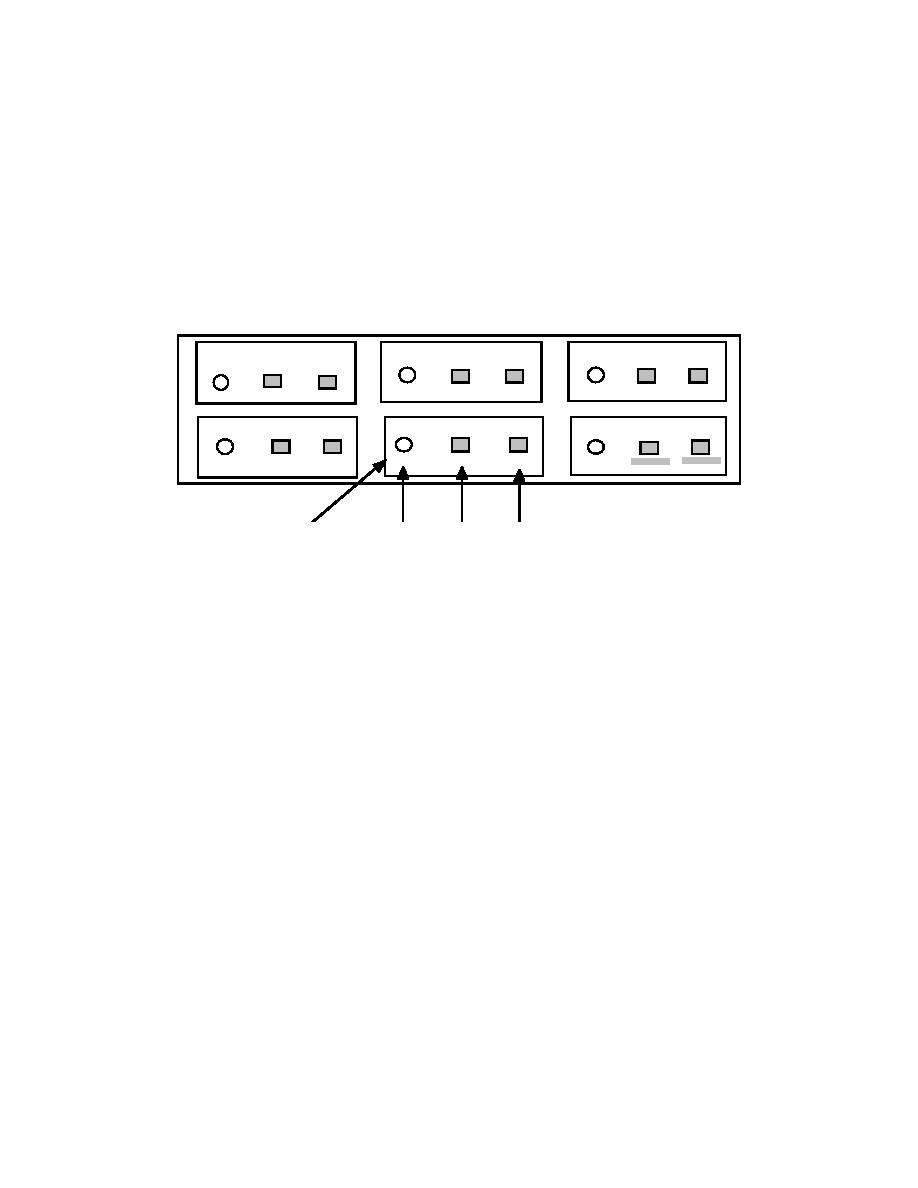
Figure 5. OUTPUTS sector. This sector is used to examine the major outputs from Object-
GASWER. A box exists for every major output. Each box contains the object which calculates the
output, a graph showing the behavior of the output, and a table showing the hourly numeric value
of the output.
OUTPUTS SECTOR
The major outputs from Object-GAWSER can be examined in a sector entitled OUTPUTS (see
Fig. 5), which is located beneath the DATA INPUTS sector in the main object model. For every major
output there exists a box that contains the object that calculates the output, a graph that shows the
behavior of the output, and a table that shows the numeric value of the output for every time interval.
Once the input parameters are programmed, one can run Object-GAWSER to view the following
outputs in the OUTPUTS sector: the liquid water released from the snowpack (LIQ_WTR_REL),
infiltration (INFILTRATION), surface runoff (SRF_RUNOFF), subsurface flow (SUBSURF_FLOW),
baseflow (BASEFLOW), and discharge (DISCHARGE). For example, LIQ_WTR_REL can be exam-
ined in the box in the upper left-hand corner of the OUTPUTS sector entitled "Liquid Water Released
from the Snowpack." Like objects, the contents of graphs and tables can be viewed by double-click-
ing on them. After double-clicking on the graph or table, a window will appear on the screen. Win-
dows for graphs and tables are removed from the screen by clicking in the box in the upper left-hand
corner of the window.
PROGRAMMING INSTRUCTIONS
This section describes how each input parameter in the DATA INPUTS sector should be pro-
grammed. Programming instructions for each input parameter are grouped according to each blue
box in the DATA INPUTS sector. Sample values for each input parameter for a watershed in south-
western Ontario are listed in the Appendix.
General inputs
BARE (decimal) is the percentage of ground in the watershed not covered by snow. To simulate a
6


 Previous Page
