1.6
Salting-out
SPE-C vs. SOE
SPE-M vs. SOE
SPE-M
SPE-C
1.2
vs. SOE
vs. SOE
0.8
Cartridge-SPE
0.4
0
0.2
0.4
0.6
0.8
1.0
1.2
1.4
TNT Concentration by SOE (g/L)
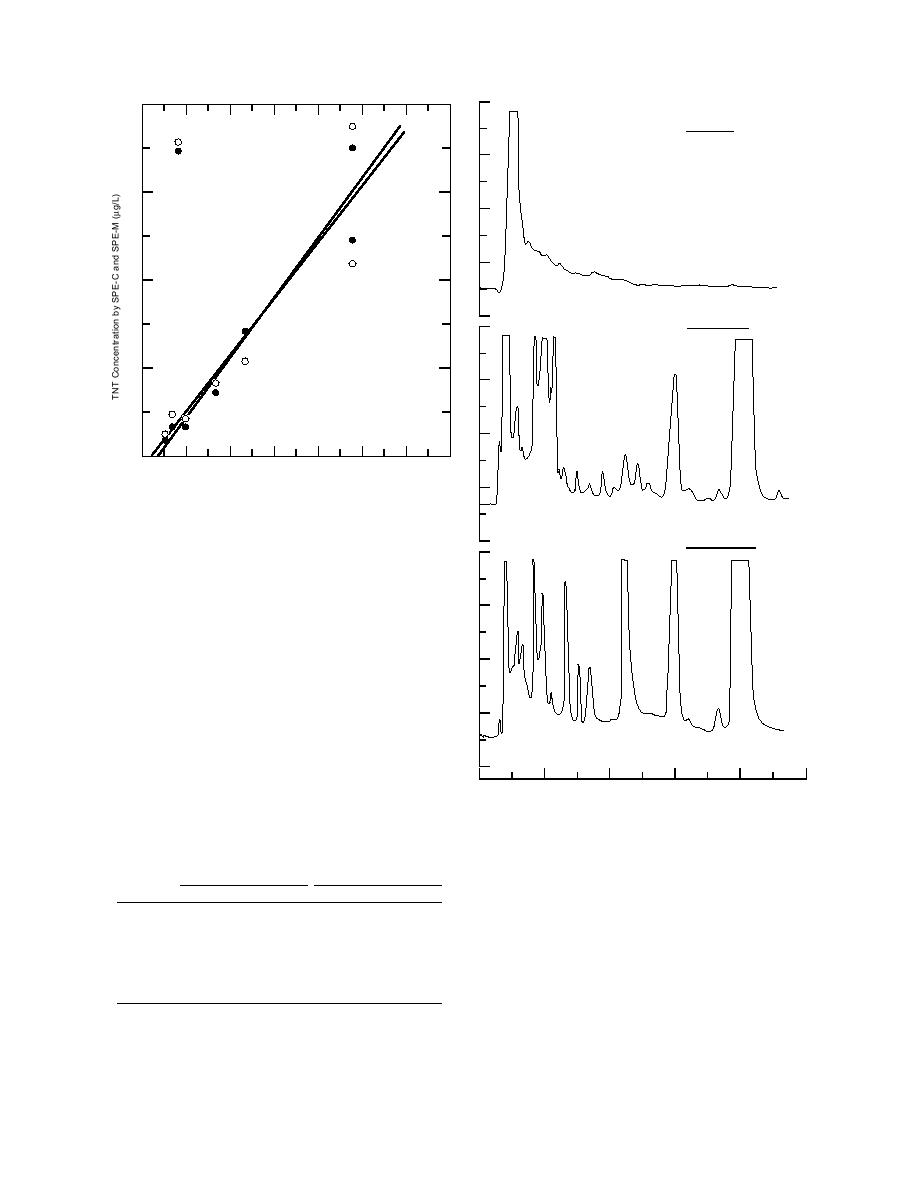
Figure 4. Plot of TNT concentrations determined for
groundwater samples using SOE with those using SPE-C
and SPE-M.
Membrane-SPE
slopes, intercepts, and correlation coefficients
squared are presented in Table 5. Similarly, regres-
sion analyses were conducted for 4ADNT, 2ADNT,
and 3,5-DNA (Table 5). Slopes for these 12 regres-
sion analyses range from 0.930 to 1.400, with inter-
cepts ranging from 1.044 to +0.875. Values for the
square of the correlation coefficients range between
0.933 and 0.999. The results from these regression
analyses indicate that the two SPE methods are pro-
ducing data that are very similar to those obtained
from SOE, even at concentrations below 1 g/L. The
TNT data for concentrations below 0.5 g/L is par-
ticularly striking in this respect (Fig. 4).
0
4
8
16
20
12
Retention Time (min)
Table 5. Results of regression analyses of SPE-C and
Figure 5. LC18 RP-HPLC chromatograms for sample
SPE-M vs. SOE for low-concentration* determina-
30 preconcentrated using SOE, SPE-C, and SPE-M with
tions.
initial less-clean SPE materials.
SPE-C vs. SOE
SPE-M vs. SOE
r2
r2
Examination of chromatograms for
Analyte
m
b
m
b
groundwater samples
HMX
1.083
0.125
0.999
0.972
0.113
0.999
In our initial comparison of SOE, SPE-C, and SPE-
RDX
1.255
1.044
0.987
1.160
0.850
0.980
M, we found a series of groundwater samples that
TNT
1.264
0.052
0.933
1.325
0.085
0.972
4ADNT
1.400
0.448
0.994
1.208
0.360
0.992
caused the solid-phase materials to release high con-
2ADNT
1.270
0.110
0.981
1.484
0.875
0.974
centrations of interferences. This is illustrated for the
3,5DNA
0.972
0.007
0.996
0.930
0.014
0.996
chromatograms obtained for sample 20641 (Well
* Concentrations below that detectable using the direct method.
10C40P2) in 1992 using SOE, Porapak R (SPE-C), and
m -- Slope.
Empore SDB (SPE-M) (Fig. 5). Chromatograms for
b -- Intercept.
this same sample obtained using the new, manufac-
r2 -- Correlation coefficient squared.
turer-cleaned Porapak RDX and SDB-RPS are shown
8


 Previous Page
