40
tains technical and other forms of information on
each series of ships. Technical information consists
Beam
of length, beam, depth, draft, deadweight, dis-
30
placement, propulsion machinery, nominal speed,
bow shape, propulsion power, fuel capacity, fuel
20
Depth
rate, etc. Non-technical information consists of the
name (or former name), names of sister ships, own-
Draft
ership, shipyard and year of construction, home
10
port, ice classification, etc.
0
40
80
120
160
200
Length (m)
SIZES AND DIMENSIONS
a. Icebreakers (cargo ships not included) (after Dick
and Laframboise 1989).
The main dimensions of a polar ship are its
length, beam width and depth. The draft is the
40
depth of the ship's keel below the waterline,
whereas the depth is the distance between the keel
Beam
and the deck. The depth of water in which a ship
Depth
can operate without touching bottom depends on
Draft
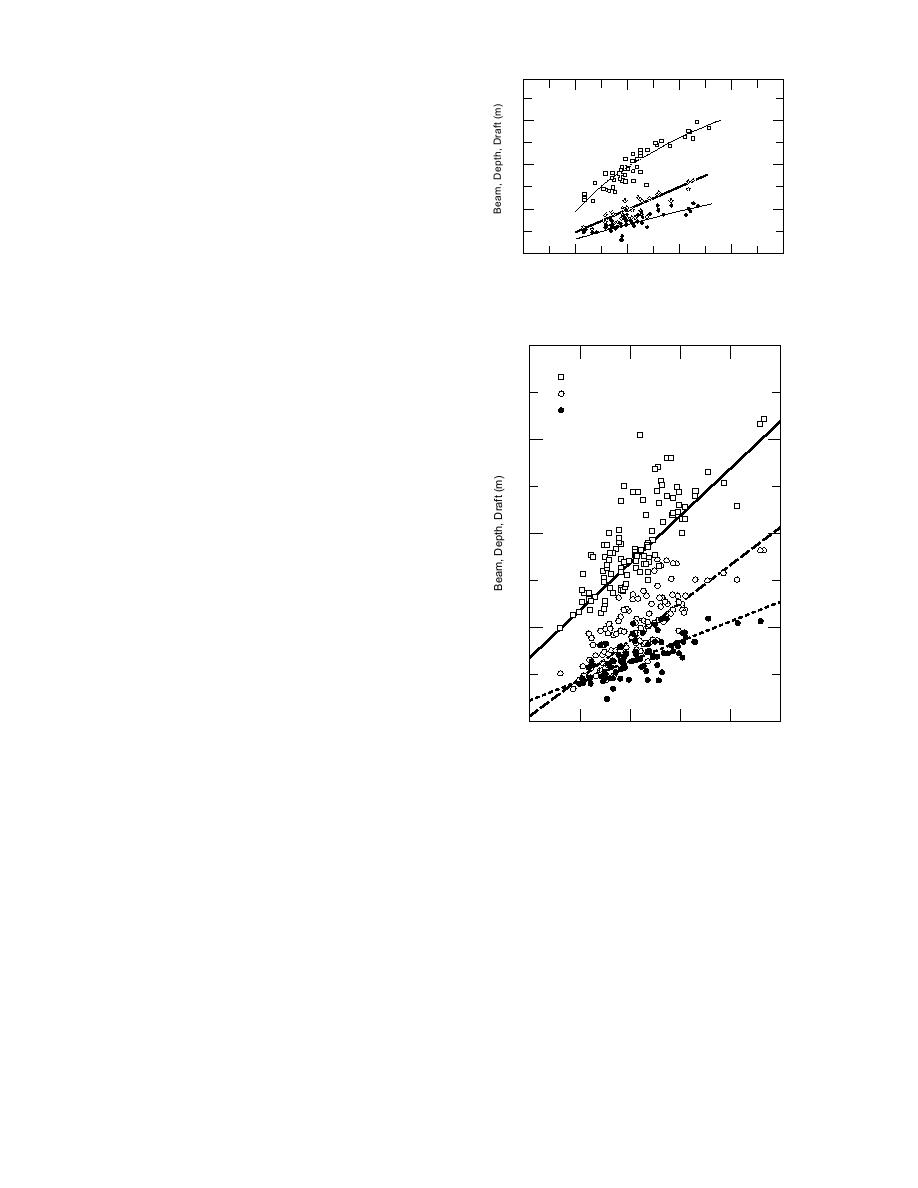
the draft. Figure 5a shows plots of the dimensions
30
of icebreakers (cargo ships not included) as com-
piled by Dick and Laframboise (1989), whereas Fig-
ure 5b shows the dimensions of all ships as com-
piled in the database given in Appendix B. The
scatter in the plot of data in Figure 5b is greater
than that in Figure 5a, because ships listed in Ap-
20
pendix B are not only icebreakers but also other
ships having some icebreaking capability. The
trends of the lines shown in Figure 5a pertain only
to icebreakers, whereas the lines of best fit shown
in Figure 5b pertain to the data on vessels listed in
10
Appendix B.
Beam
In Figure 5a, the mean length-to-beam ratio of
icebreakers varies from 3.6 to 4.6 for lengths from
0
40 to 140 m respectively. North American vessels
0
50
100
150
200
250
are narrower than those from Finland, Sweden and
Length (m)
Russia. This may be attributed to the practice of
b. All vessels included in the inventory of ships
convoy escort used in the Baltic Sea and Russian
listed in Appendix B.
Arctic. The line of best fit in Figure 5b has an inter-
Figure 5. Dimensions of vessels.
cept of 6.7 m and a slope of 0.102 m/m.
40 to 140 m respectively. Draft, like other dimen-
Depth
sions, is usually defined by the operating require-
In Figure 5a, the mean length-to-depth ratio of
ments of the ship. The line of best fit in Figure 5b
icebreakers varies from 8.9 to 8.2 for lengths from
has an intercept of 2.2 m and a slope of 0.042 m/m.
40 to 140 m respectively. This ratio is high for sup-
ply vessels and low for conventional icebreakers.
Maximum deadweight
The line of best fit in Figure 5b has an intercept of
Figure 6 shows a plot of deadweight at maxi-
0.6 m and a slope of 0.08 m/m.
mum draft vs. the overall length of the vessels
listed in Appendix B. The curve shown in Figure 6
Draft
is a best fit quadratic curve having the following
In Figure 5a, the mean length-to-draft ratio of
equation
icebreakers varies from 11.4 to 12.2 for lengths from
7


 Previous Page
