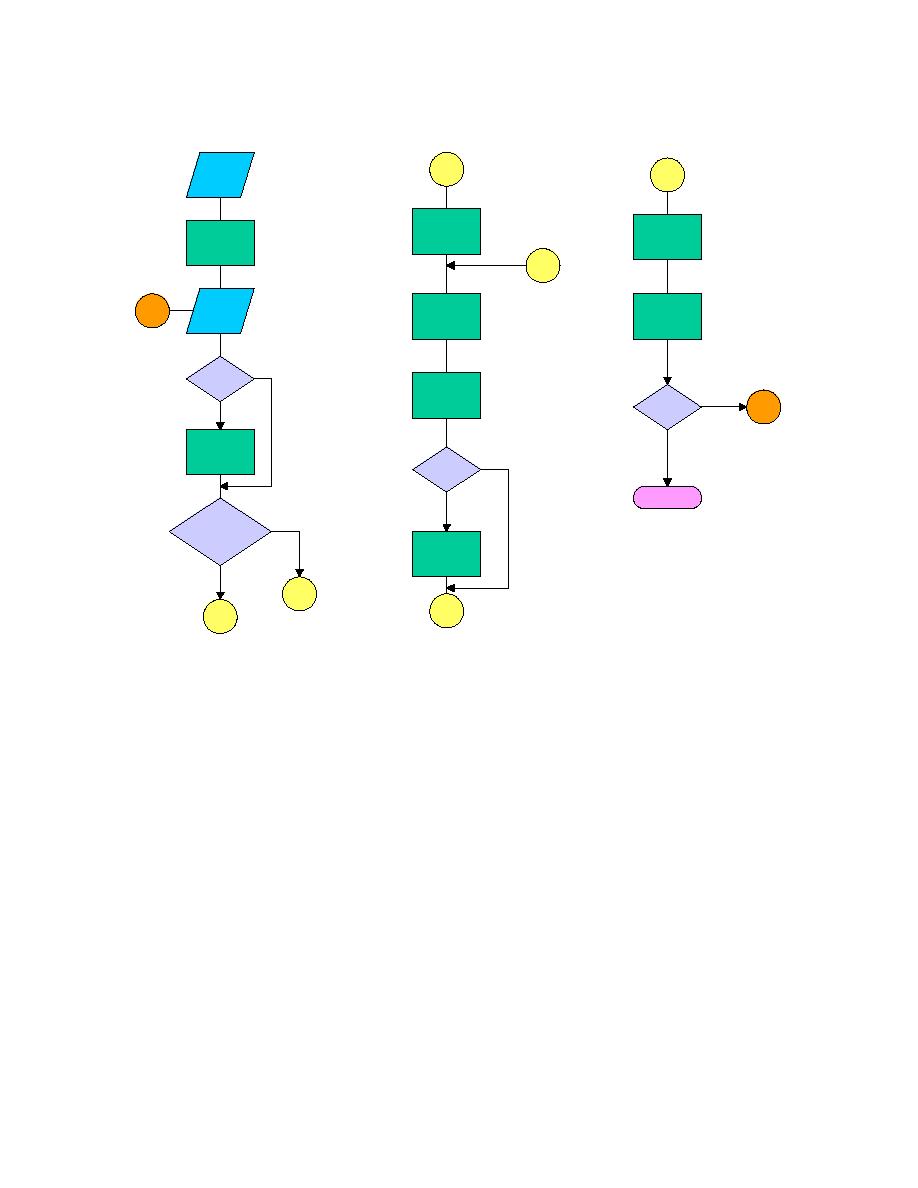
A graphic representation of the above process is shown in Figure 1.1.
Read in
A
B
Site data,
Init. Cond.
Calculate
Calculate
soil
Initialize
soil strength
temperature
soil profile
a
Calculate
Update
Read in
ii
soil
soil
met data
moisture
properties
Yes
Yes
Have IR,
Solar
Calculate
Yes
More
ii
Freeze/Thaw
No
met data
Calculate
No
Solar, IR
Yes
Snow
Print results
No
Have
Yes
Measured
Calculate
Soil temps
snow
depth
No
a
B
A
Figure 1.1 Flowchart of the FASST Modules.
1.3 References
Sullivan, P.M., C.D. Bullock, N.A. Renfroe, M.R. Albert, G.G. Koenig, L. Peck, and
K. O'Neill (1997) Soil Moisture Strength Prediction Model Version II (SMSP II). U.S.
Army Corps of Engineers Waterways Experiment Station, Technical Report GL-97-15.
3


 Previous Page
