10
8
6
4
2
0
5
10
15
20
Applied Axial Strain (%)
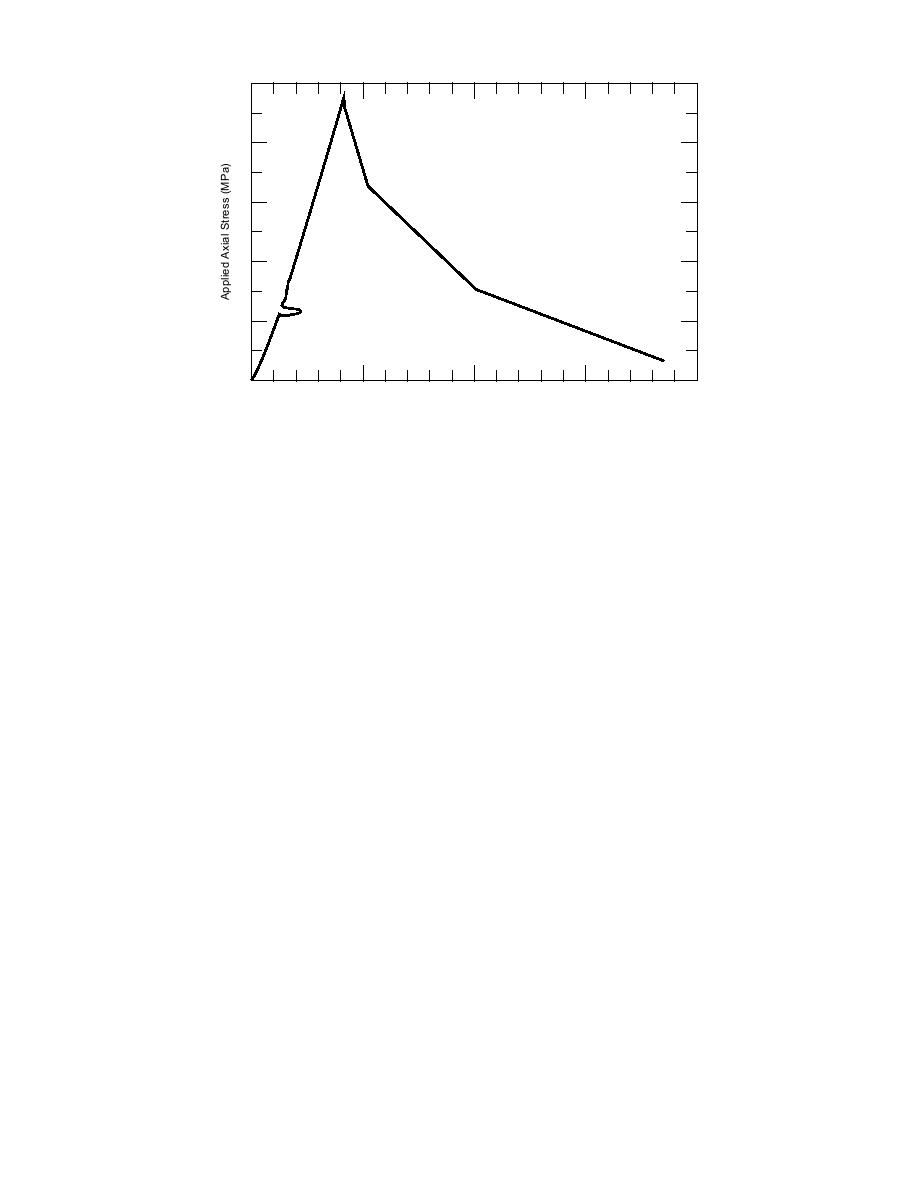
Figure 6. Stressstrain curve from ice at a depth of 10.515.5 cm, extracted at the
south end of the runway (10,000 ft). Applied loading rate was 44.5 kN/s.
The results of unconfined compression tests on
(U.S. Army and Air Force 1968). A more rigorous
a few Pegasus runway ice core samples are shown
approach, specifically for glacial ice, should fol-
in Figures 6 and 7 (more information can be found
low the system developed within the USAP for
in Lang and Blaisdell, in prep.). Most of the core
determining suitable floating sea ice thicknesses
samples were not suitable for testing since the
to assure that the anticipated aircraft loads can be
supported during landing and parking (Barthel-
cores shattered during the coring process. Few
emy 1992).
specimens with adequate length for compressive
At the Pegasus runway, initial coring revealed
tests were available. The tested samples were ex-
two very distinct ice types and several discontin-
tracted at the south end of the runway. Unfortu-
uities. The uppermost ice layer throughout parts
nately, this is not the location of the weakest
of the region is glassy, bluish in color, and in-
meltwater ice.
cludes many parallel, long, cylindrical bubbles
Figure 6 shows the stressstrain curve from ice
(Fig. 4). This ice suggests at least one cycle of
at a depth of 10.515.5 cm from the south end
melt/refreeze behavior. Ice samples from lower
core; this is snow derived ice (i.e., glacial ice). The
in the core are cloudy with a milky white hue
applied loading rate was 44.4 kN/s (10,000 lbf/s).
(Fig. 5). The enclosed bubbles make up a larger
This rate represents the approximate loading rate
volume fraction but are spherical in shape and
of a C-141 tire rolling at 1.7 km/hr (1 mph). The
test temperature was 10C. Figure 6 shows a
range in size from 1 to about 5 mm. This ice is
typical of glacial ice formed by natural consolida-
clear linear relationship between stress and strain
tion of snow. In most cores, the contact between
to failure. This is indicative of a brittle failure
the two ice types is sharp but firmly bonded, but
mode in the ice. The failure stress is approxi-
a thin gap was occasionally detected (by probing
mately 10 MPa (1450 psi).
down in the core hole). This gap was about 5 mm
The test results in Figure 7 are for an ice sample
thick and contained hoar (faceted) crystals on both
located lower in the horizon (2027 cm deep). Its
surfaces. Examination of the ice cores in meltwa-
failure strength is approximately one-third of the
ter ice revealed that the ice contained many large
strength of the sample that was closer to the sur-
cracks. The ice exhibited failure planes that sug-
face. This may be a result of grain size effect;
gested doming and radial (star-like) pattern sur-
grain size increased with depth at the south end
face fractures. These features are probably the
of the runway. The larger grain size could ac-
result of natural processes (discussed later).
count for the reduction in strength. Figure 7 also
7


 Previous Page
