Extreme ice thicknesses from freezing rain
Final Report
recurrence intervals. Similarly, the corresponding metric maps use 5-mm increments for the 50
and 100-yr maps, and 10-mm increments for the 200 and 400-yr maps. Major terrain features
were used in defining some of the ice zones on the maps. For comparison, a color relief map of
the United States is available at http://fermi.jhuapl.edu/states/us/big_us_color.gif .
As is described in Jones et al. (2002), the 50-yr ice thicknesses are calculated by grouping the
~500 weather stations into superstations to generate longer periods of record for the extreme
value analysis. By doing this, the 50-yr values are within the sample of extremes rather than far
out in the tail of the distribution. However, the 100-yr to 400-yr extremes are farther out in the
tail and thus may still be significantly affected by the tail shape parameter, which in turn is
affected by the random occurrence, or not, of storms with long mean recurrence intervals (e.g.
the January 1998 storm in the northeast) in the period of record. To decrease this variation
between superstations, 100-, 200- and 400-yr values are calculated for each superstation using an
average multiplier on the 50-yr value for each mean recurrence interval. The same multipliers are
used for all superstations in zones with 50-yr ice thicknesses of 0.5 in. or more. Separate
multipliers are used for stations in the 0.25-in. and 0-in. zones. These factors are calculated as the
average of the ratios of ice thickness (e.g. the 100-yr value divided by the 50-yr value) weighted
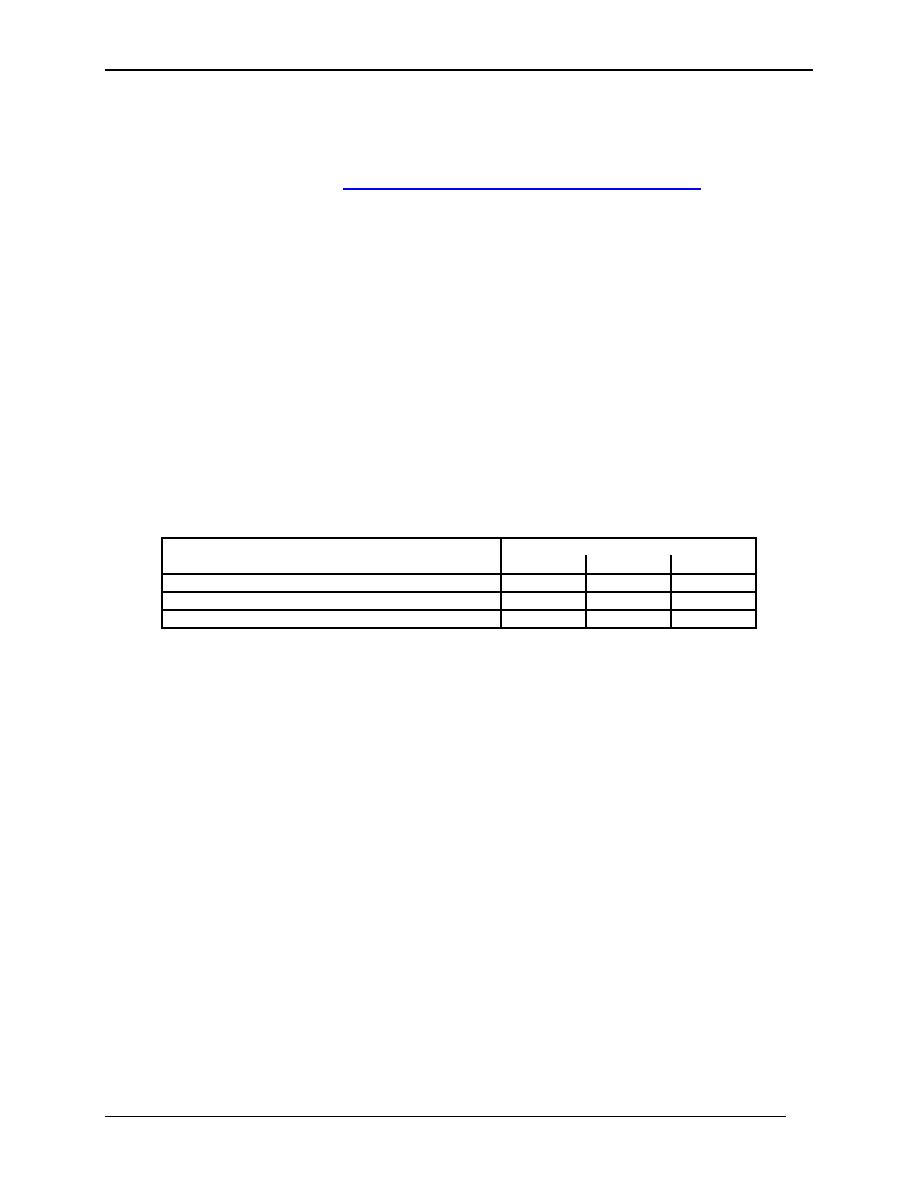
by the number of years in the period of record for each superstation. The factors are shown in
Table 2-1.
Factor to multiply 50-yr value
100-yr
200-yr
400-yr
Superstations in 50-yr 0.5" zone and greater
1.25
1.55
1.91
Superstations in 50-yr 0.25" zone
1.34
1.76
2.31
Superstations in 50-yr 0" zone
1.62
2.42
3.49
Table 2-1. Factors on 50-yr thicknesses
The 50-yr map was developed over the past 8 years as CRREL, utility organizations (e.g. EPRI,
CEA), individual utilities (e.g. VELCO, NYPA, BPA), and FEMA funded the mapping of
various regions of the country. Partial maps were included in ASCE Standard 7 Minimum
Design Loads for Buildings and Other Structures, initially in the 1995 revision, and then in the
1998 and 2002 revisions as additional regions were analyzed. The map in this document is in the
draft for ASCE 7-2005. There are discrepancies between this 50-yr map and the maps for the
longer recurrence intervals. On the 50-yr map, zones in southern Minnesota-northern Iowa and
eastern Pennsylvania-northern New Jersey are shown with ice thicknesses greater than the
surrounding area, but these zones are not delineated on the 100-, 200-, and 400-yr maps. Those
are only two of the many relatively small areas across the country with significant local
variations in the severity of icing associated with variations in terrain and thus, should not be
delineated. A list of examples for ASCE Standard 7 of areas where extreme ice thicknesses are
expected to be greater than in the surrounding terrain include: Signal and Lookout Mountains in
Tennessee; Ponatock Ridge and the edge of Yazoo Basin in Mississippi; Shenandoah Valley and
Poor Mountain in Virginia; and Mt. Washington in New Hampshire. As a result of the State
Climatologist review, Buffalo Ridge in southwest Minnesota is being added to this list.
September 2004
Page 5


 Previous Page
