APPENDIX C: VARIOGRAM FUNCTION FOR VARIABILITY ANALYSIS
where the separation distance is plotted on the x
VARIOGRAM FUNCTION
axis and the variance (of the difference) on the y
axis. The separation distance at which the
The variogram function is a mathematical
variogram levels out, referred to as the "range,"
model that expresses the statistical variance as a
indicates the distance beyond which the measured
function of separation distance. If 10 Clegg im-
parameter is no longer correlated.
pact tester (CIT) readings were taken at the same
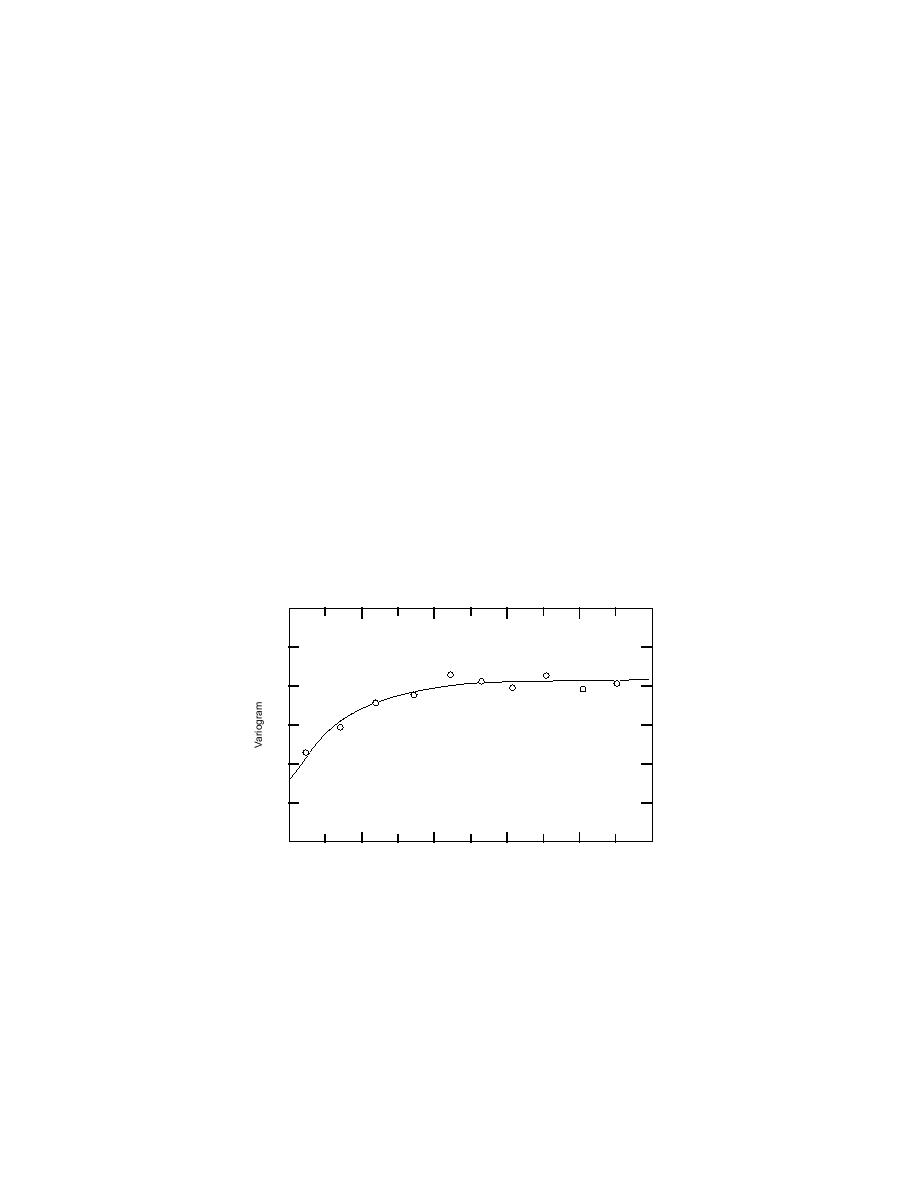
Figures C1aC1d show variograms with corre-
point, there would be very little spread to the data
lation ranges of 125, 67, 61, and 40 m (410, 220,
set. Furthermore, this is true whether these 10
200, and 130 ft) corresponding to gravimetric wa-
tests are conducted at station 1+00, station 2+00
ter content, ln CBRCLEGG, ln thaw depth, and per-
or station 10+00. (Statistically, this spread is mea-
sured by variance.) Now we allow a second set of
centage of initial standing water. As stated above,
CIT readings to be taken at 3-m (10-ft) separation
these variograms indicate the distance over which
distances, i.e., one each at stations 0+00, 0+10,
any one parameter is correlated. The water con-
0+20, etc. This time, there will be some small
tent variogram, for instance, shows that wooded
variance. Additionally, this small variance will be
trail water contents are correlated for up to a
approximately the same as the variance for read-
distance of approximately 125 m (410 ft).
ings taken at stations 0+05, 0+15, 1+25, etc., or at
A variability analysis showing the influence of
stations 0+08, 0+18, 0+28, etc. The same proce-
subgrade variability on test section performance
dure is repeated for increasingly larger separation
at Fort McCoy is outlined in Kestler (1996). Geo-
distances until the variance becomes somewhat
statistical and Statistical software used include
constant in magnitude. Results of this testing pro-
GEO-EAS (Englund 1992) and Statgraphics (Man-
cedure are plotted in the form of a variogram
ugistics 1994).
30
25
20
15
10
5
0
0
200
400
600
800
1000
Distance (ft)
a. Gravimetric water content.
Figure C1. Experimental variogram--wooded trail subgrade.
39


 Previous Page
