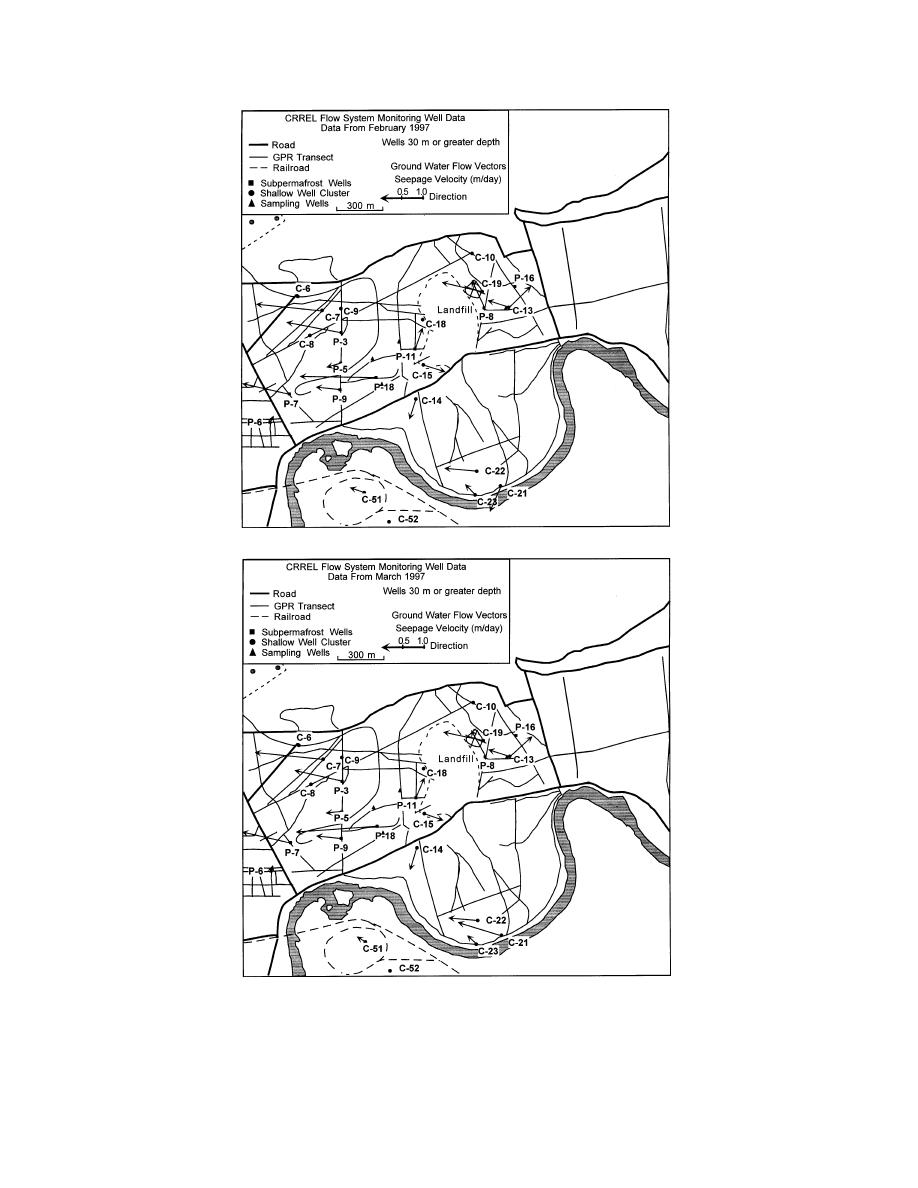
Figure A3 (cont'd). Mean flow directions, seepage velocities, and water
levels from representative 30-m-deep monitoring wells in unfrozen thaw
zones and from subpermafrost wells that exceed 30 m in depth. Vectors
are calculated from ground water flow sensor data for measurements
during September 1995 to January 1997.
64


 Previous Page
