1200
800
400
0
0.2
0.4
0.6
0.8
1.0
Pipe Diameter (m)
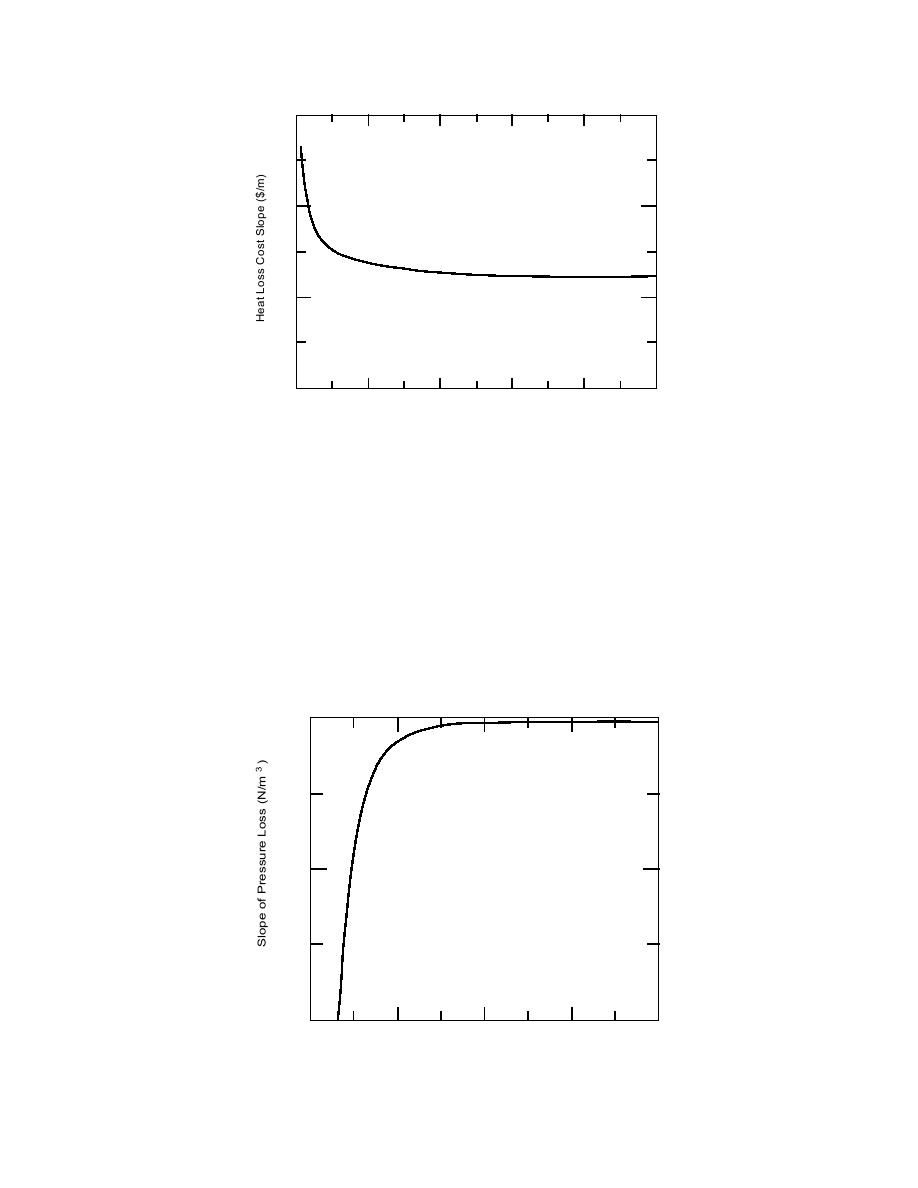
Figure 11. Slope of the heat loss cost term as a function of pipe diameter.
This result is plotted in Figure 12, where we have arbitrarily set the aggregate of all
the coefficients of d equal to 1. We see that the slope is everywhere negative and that
it is increasingly negative for decreasing values of the pipe diameter. This tells us
that an incremental increase in the pipe diameter will have a greater effect on
reducing the pressure loss at smaller pipe diameters than at larger ones. Thus, if we
have a choice of several possible pipe segments whose diameters we can increase,
we can achieve a larger pressure loss reduction for a given increase in pipe size by
choosing the pipe segment with the smallest diameter.
Unfortunately, our results tell us we should favor the smaller diameters from a
pressure losses reduction standpoint, but from the standpoint of heat loss costs,
0
2000
4000
0.2
0.4
0.6
0.8
1.0
Pipe Diameter (m)
Figure 12. Slope of the pressure loss as a function of pipe diameter.
57


 Previous Page
